
The Creativity of Crowds
Measuring the Effects of Explicit Instructions and Incentives on the Idea Generation Rate of a Crowd-Based Population
Generating new ideas is at the core of innovation. Management researchers have long sought strategies for increasing the rate and quality of ideas generated among workers. Additionally, the advent of internet-based communications has created opportunities for valuable ideas to be generated – and harnessed – from crowds of individuals. The first section of this paper reviews the early and recent literature on measuring creativity, focusing specifically on the effects of incentives and explicit instructions on the rate of idea generation. The following section describes the crowdsourcing platform through which the research was conducted – Amazon Mechanical Turk (AMT) – and reviews recent work that has utilized this platform for experimental research. The project at hand engages participants in a divergent thinking exercise to measure the rate of idea generation for the crowd-based population. The findings show more unique ideas occur later in the response period, demonstrating the presence of the serial order effect; that explicitly instructing respondents to “Be Creative” increases the rate of idea generation; and that offering a bonus incentive for “especially creative ideas” decreases the rate of idea generation for specific demographics of respondents. The paper continues with a discussion of research limitations and areas for further exploration. Conclusions and insights are offered at the end.
It is the aim of this research to identify strategies for motivating a group of workers to generate as many ideas as possible. To this end, the research measures the fluency of responses to a divergent thinking task along with the effects of explicit instructions to think creatively and the appearance of monetary incentives on the fluency of responses generated. Three main hypotheses were formulated for this analysis based on the content and findings of the literature on creative idea evaluation and generation.
Serial Order Effect
The first hypothesis is based on the work demonstrating the serial order effect. From this work it is expected that the quantity of ideas generated will decrease over time and that more novel responses will occur later in the response period.
Question Frames
Hypotheses two and three test the effects of altered question frames on the fluency of new responses. The second hypothesis expects that explicit instructions to “BE CREATIVE” will increase overall fluency, while the third hypothesis expects the appearance of a monetary incentive will also increase the fluency of responses.
Demographic Sorting
In addition to identifying strategies for increasing the idea generation rate of a group of workers, this research also analyzes the relationship between demographic factors and fluency. This part of the analysis simulates various nominal-group compositions based on the demographic factors provided by research participants. Two hypotheses are stated for this section. First, workers based in the United States are expected to generate more new ideas than those based in India. Second, it is hypothesized that female respondents will provide more new ideas than male respondents. Finally, based on various findings of the analysis, suggestions for ideal group composition are made.
Demographics of Respondent Population
A total of 325 HITs were completed across the three question frames – 113 for the control frame, 112 for the be-creative frame, and 100 for the incentive frame. HITs that were not fully completed (i.e. respondents provided fewer than ten answers to the given question) were discarded. Additionally, HITs tagged with the same Worker ID number were filtered by response submission time and only the first completed HIT was retained. Filtering the responses in this way yielded a total of 284 respondents to the three question frames: 95 control, 95 be creative, and 94 incentive. This provided a total of 2,840 individual responses to the general question “What can you do with a brick?”
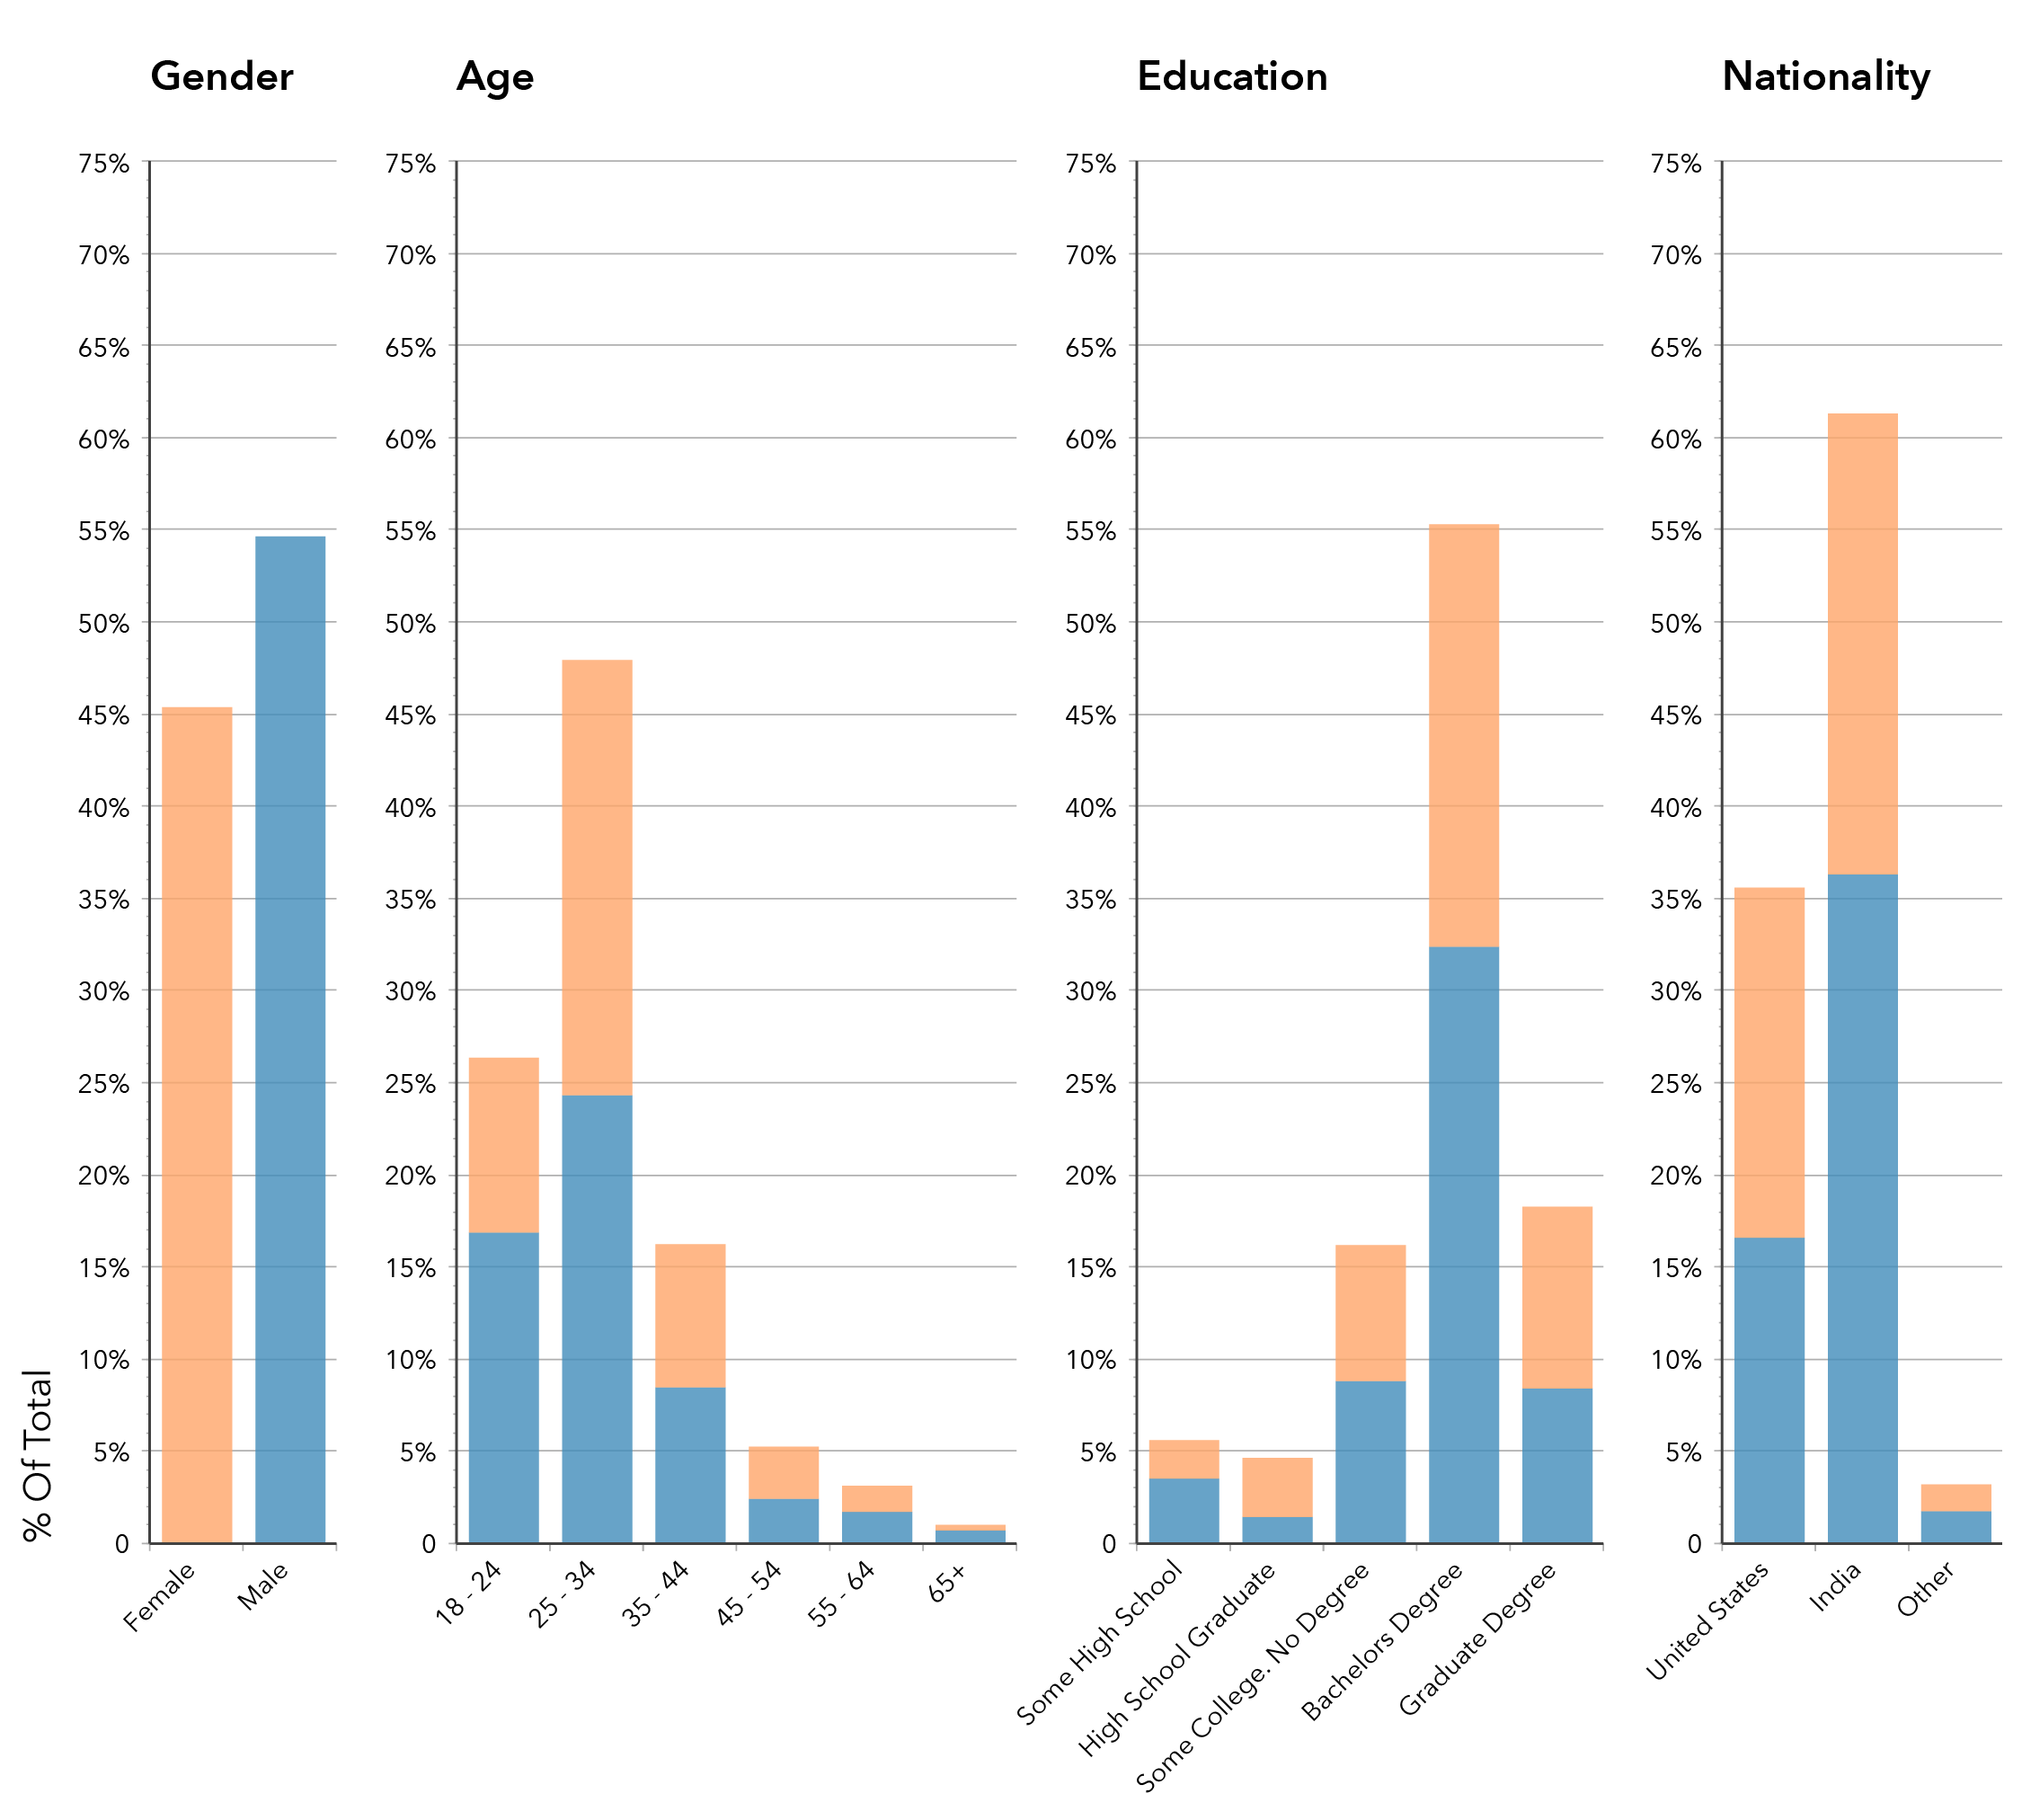
The age range of the respondent population spanned from 19 to 69 with 74.3% of respondents falling under the age of 35. This skew toward younger respondents from the AMT work pool is likely a continuation of the shift toward younger workers shown in earlier studies of the AMT population. Another trend shown in earlier longitudinal studies of the AMT crowd population and also observed in this study is the shift toward respondents from India (61.3%) and away from those from the United States (35.6%). The data is also consistent with earlier population studies in the high level of education among the entirety of the crowd population with a large percentage of respondents holding a bachelor’s degree (55.3%) or higher (18.3%).
High-Level Taxonomy of Categories of Responses
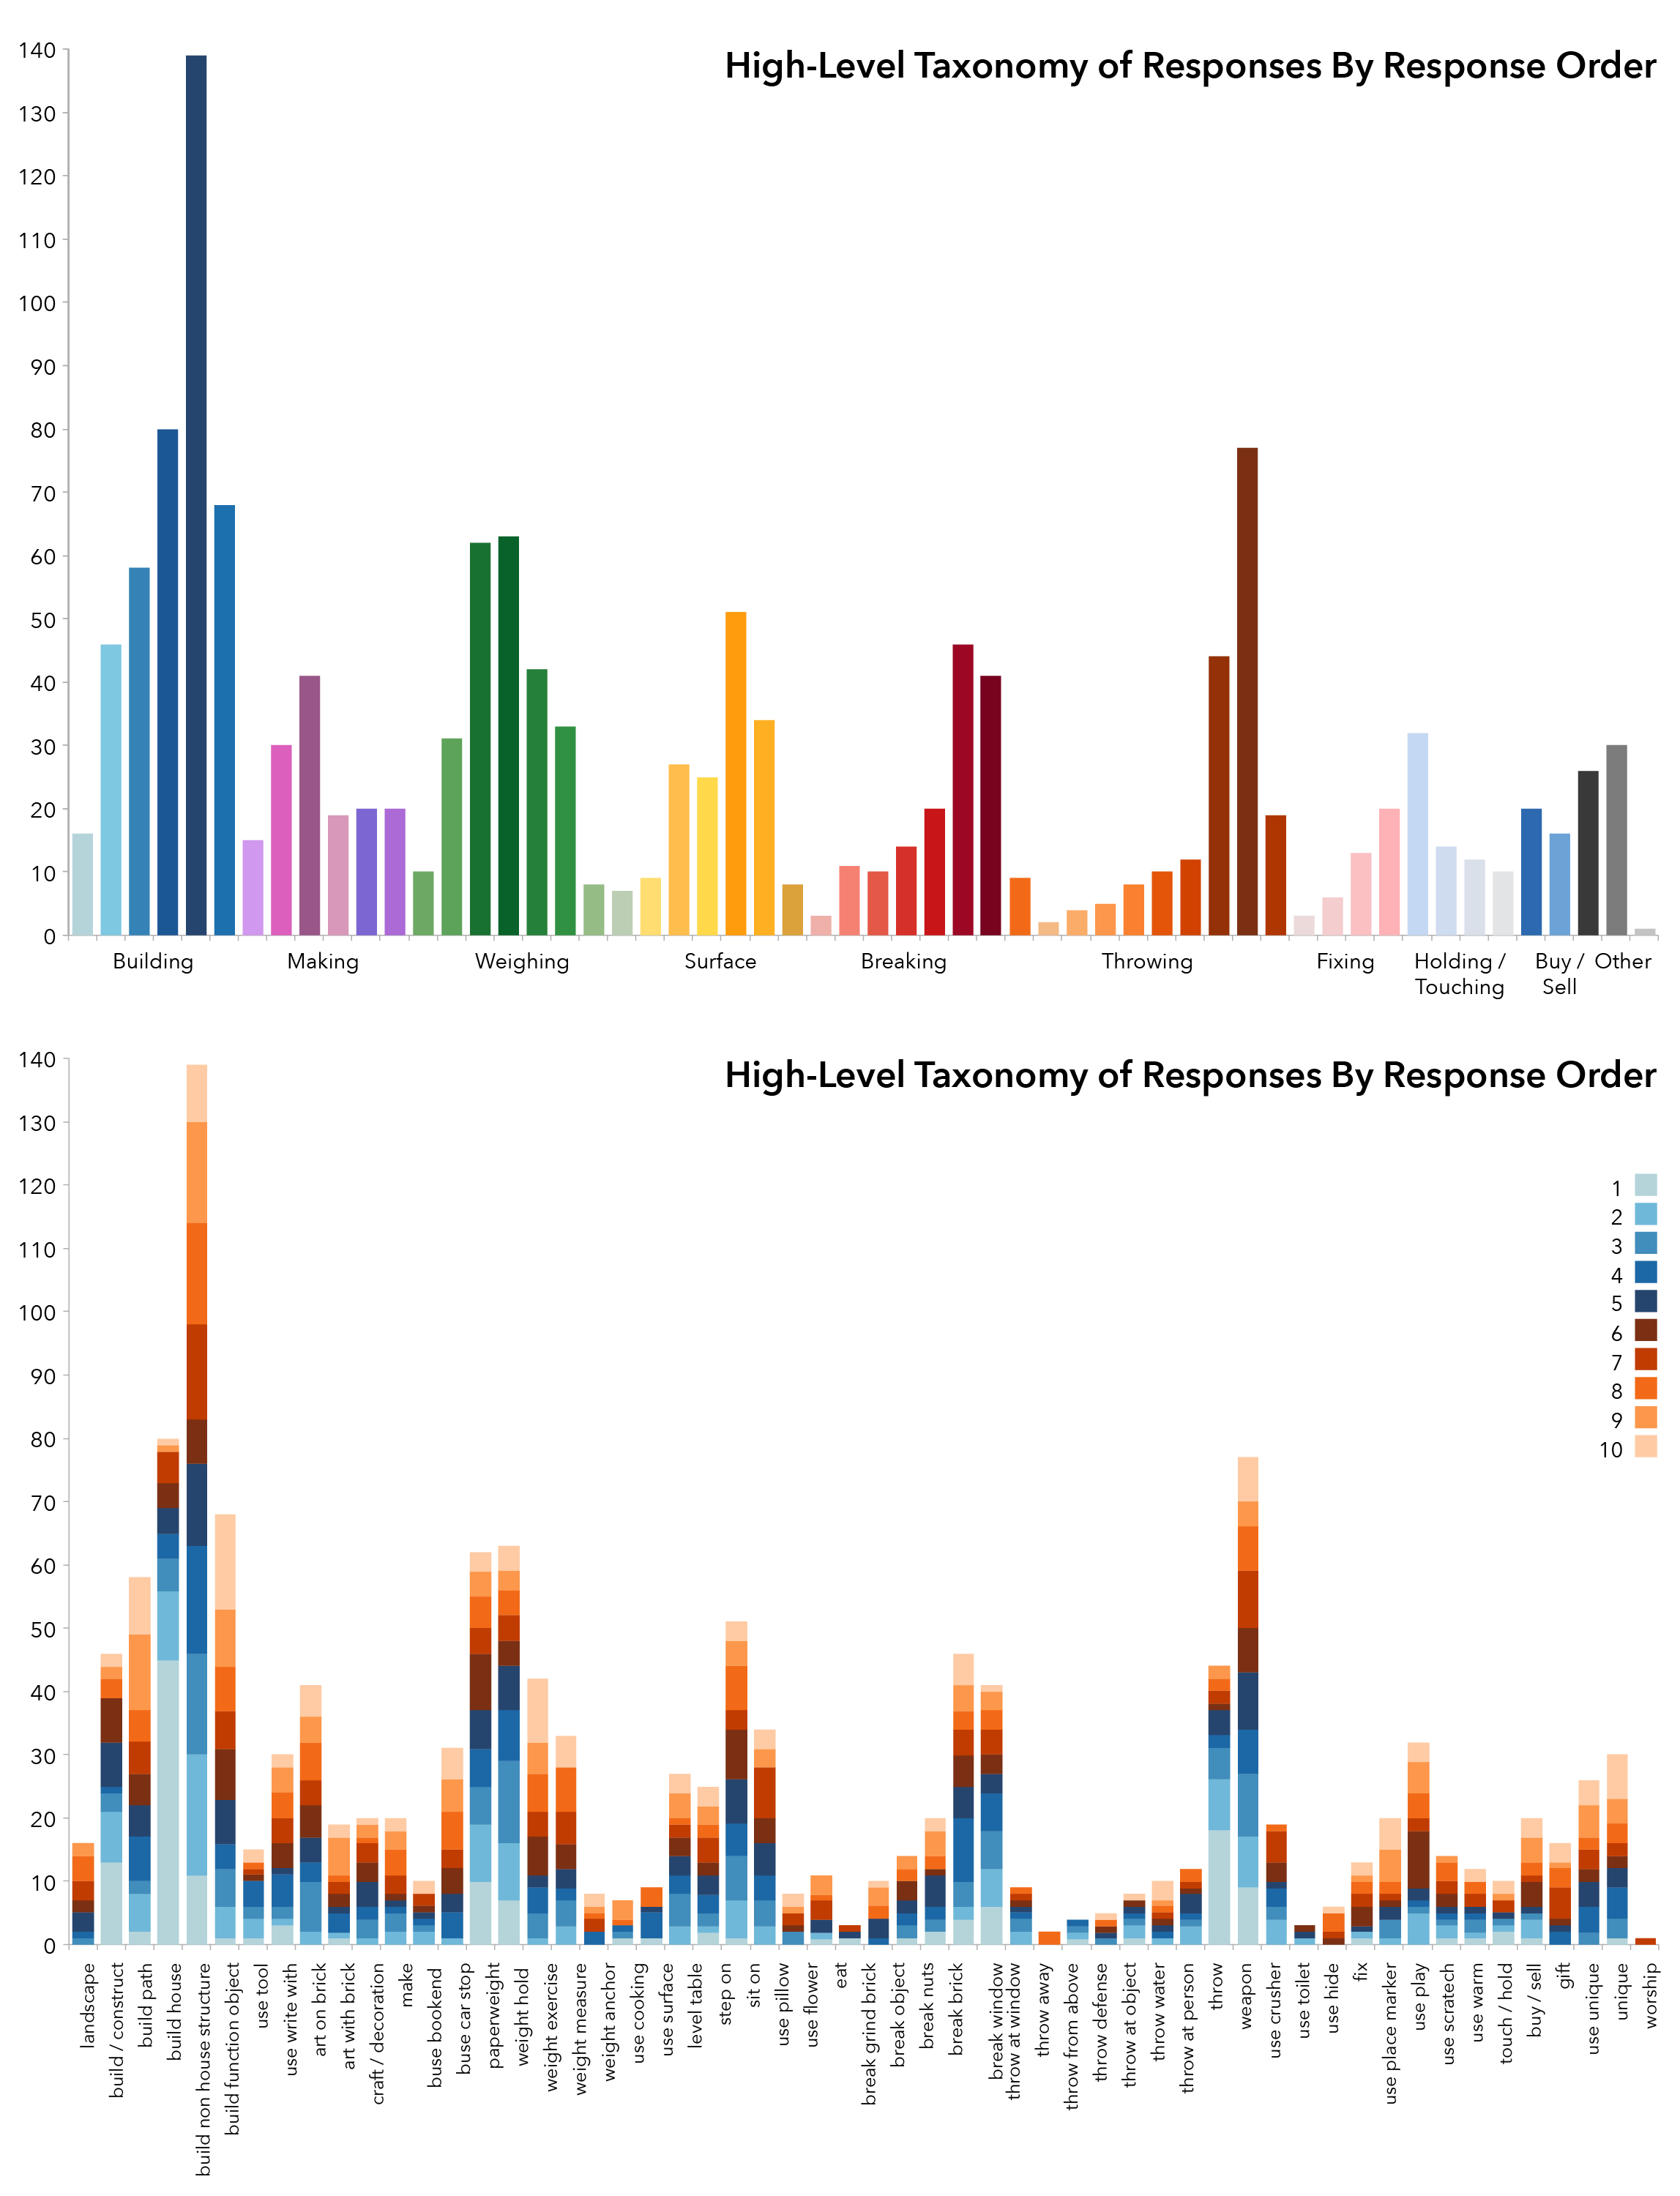
In order to analyze the fluency of responses, each new response to the brick uses question had to be identified and tagged. Tagging began by sorting responses into categories of similar uses. For example, all of the responses pertaining to building and construction were clustered together into a high-level use category called Building/Making. This category of responses was then sorted into subcategories like Build House and Build Non-House Structure. Other such categories in this taxonomy of brick uses include Throwing, Breaking, Sitting, Stepping, Weighing etc. This high–level sorting yielded a list of 14 categories and 81 subcategories for the 2,840 responses (see Appendix A for a taxonomy of high level categories and subcategories). Exhibit 4 illustrates the total number of responses for each of the subcategories in the high-level taxonomy. Responses proposing using the brick to Build a Non-House Structure were the most common responses in this sorting. Exhibit 4 also illustrates the same high-level categorization with added detail showing the total number of responses in each of the response positions (e.g. 1, 2, 3…10). This chart suggests that responses that occur with less frequency also tend to show up later in the response period.
Number of Duplicate Responses
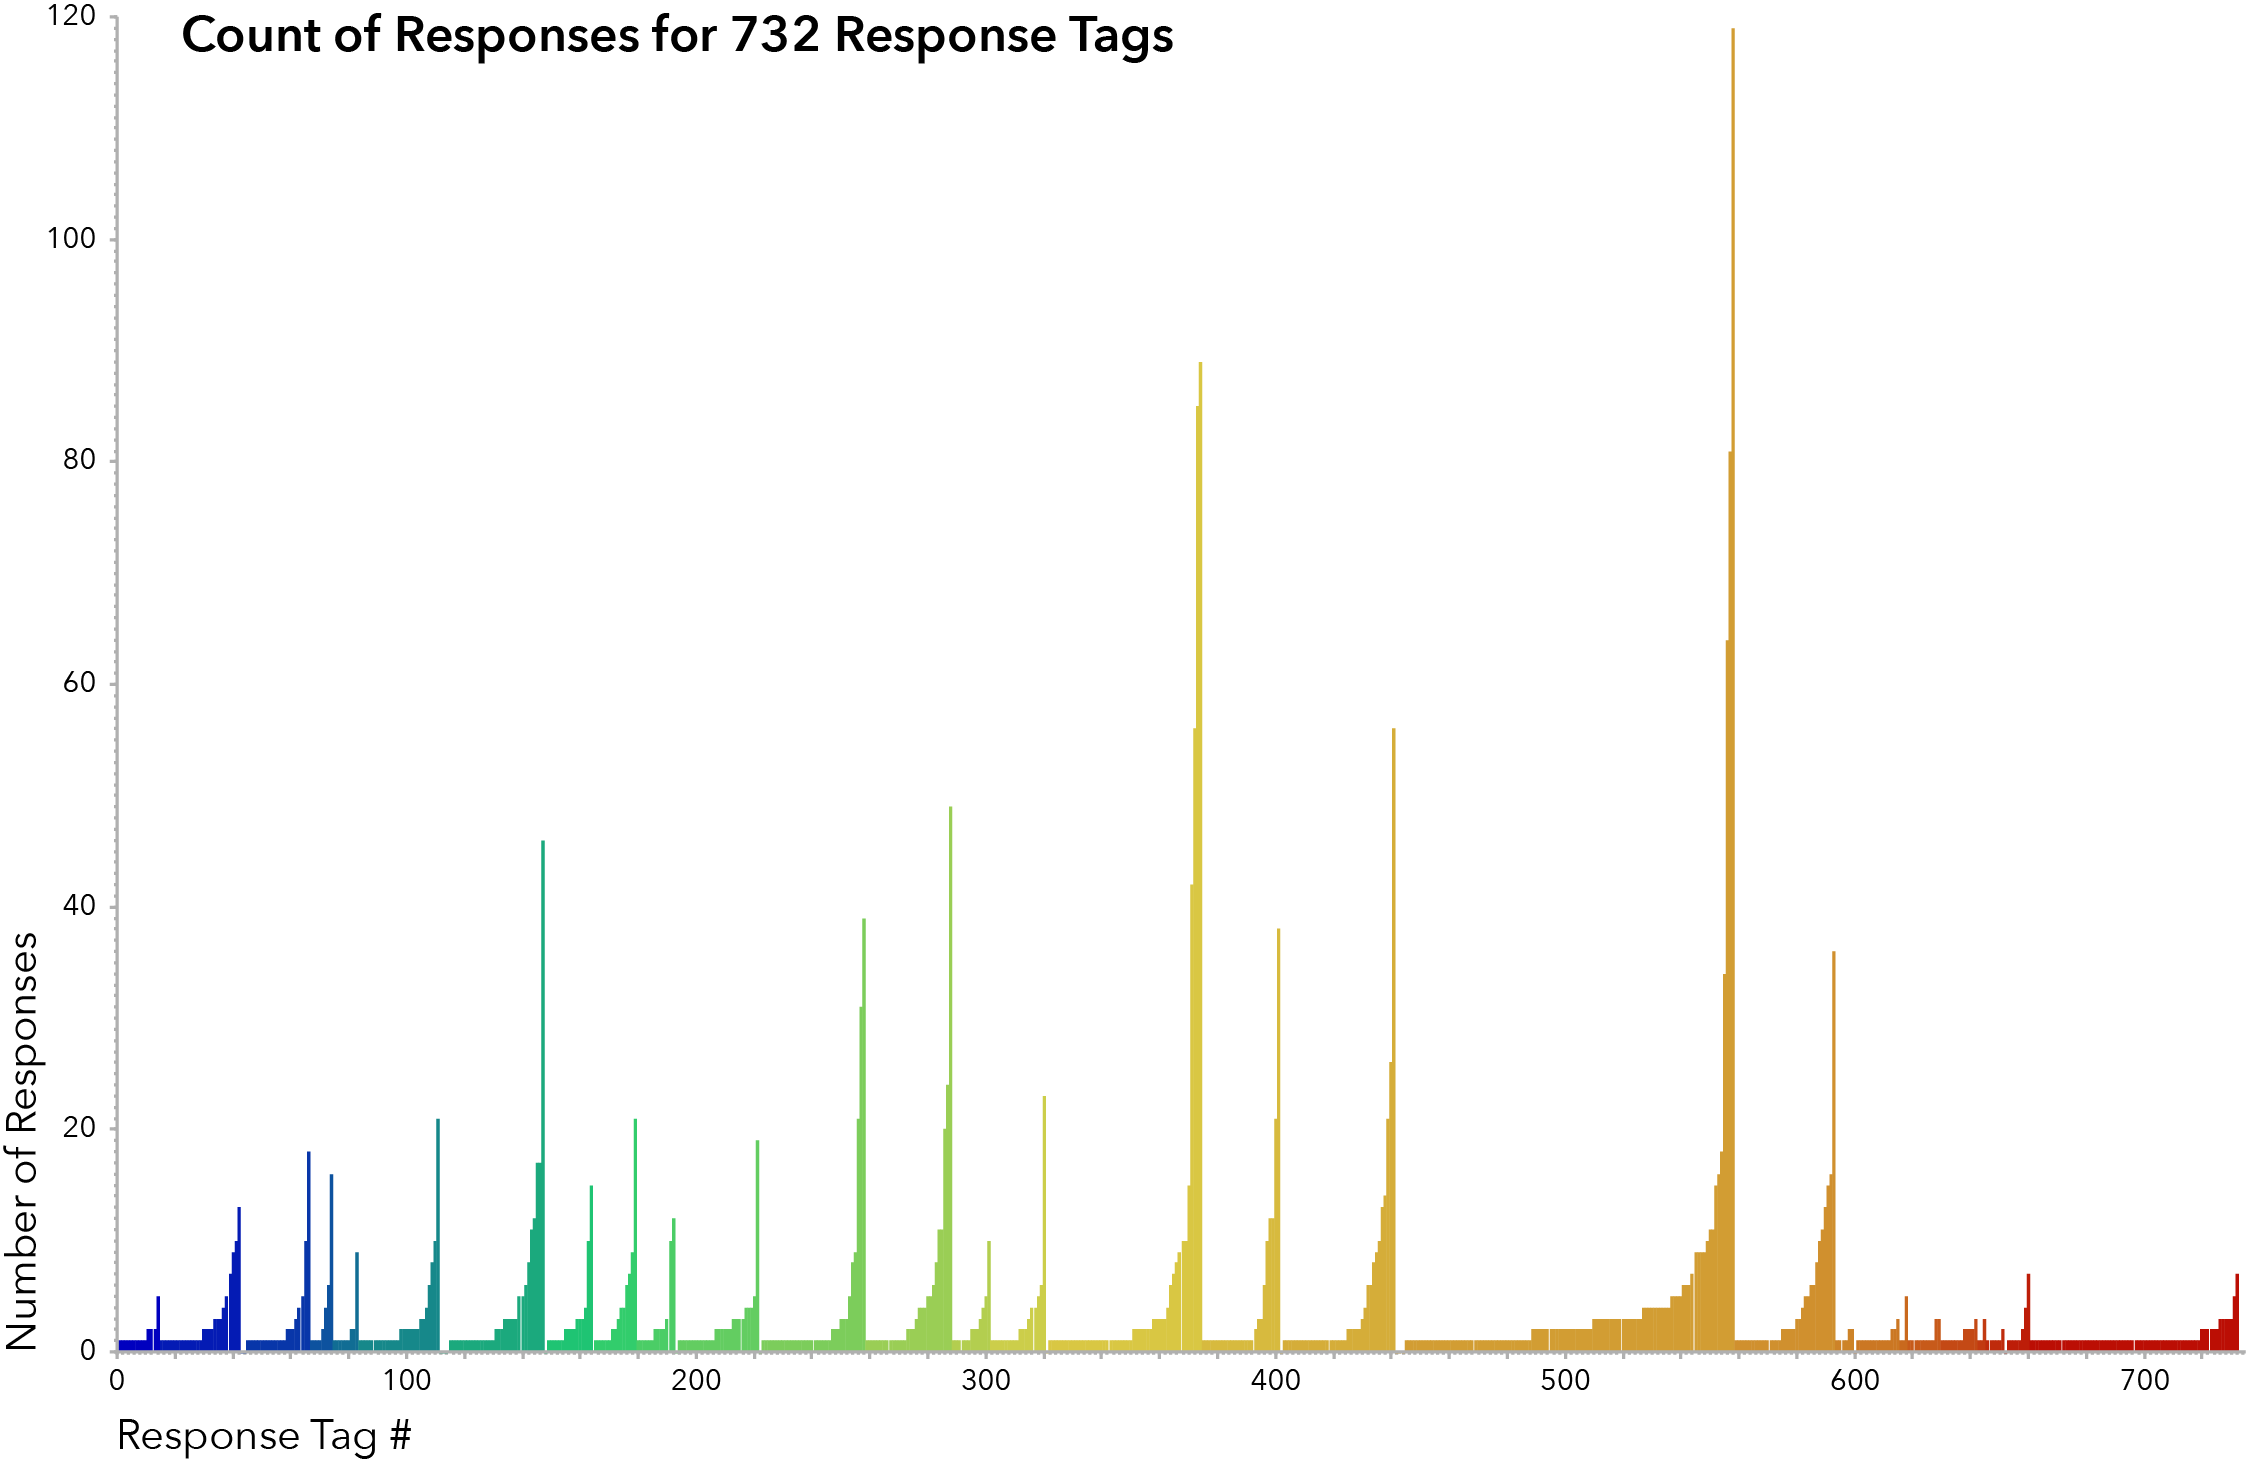
Several additional rounds of tagging and sorting were conducted, yielding a taxonomy of 29 categories and a list of 732 tags for the 2,840 responses. Tags were developed for each of the question frames separately and were then compiled into a master list of 732 tags. Basic responses were generally tagged using a two-word phrase describing the action and object of the response. For example the responses “Build a house’” and “Use the brick to build a house” were both tagged using the action-object pair Build House (see Appendix B for a complete list of tags and responses). Build House is, however, separate from the tags Build Mosque or Build Fort. Responses that included more specificity were tagged with a basic action-object pairing and additional descriptive words. For example, the response “Make artistic picture on brick” was tagged with the action-object pair of Art On [Brick] whereas the response “Draw art on the bricks and sell them on ebay” was tagged with the same action-object pair and an additional modifier Art On Brick Sell On Ebay. The 732 tags represent an exhaustive list of each new response generated across the three question frames.
Serial Order Effect
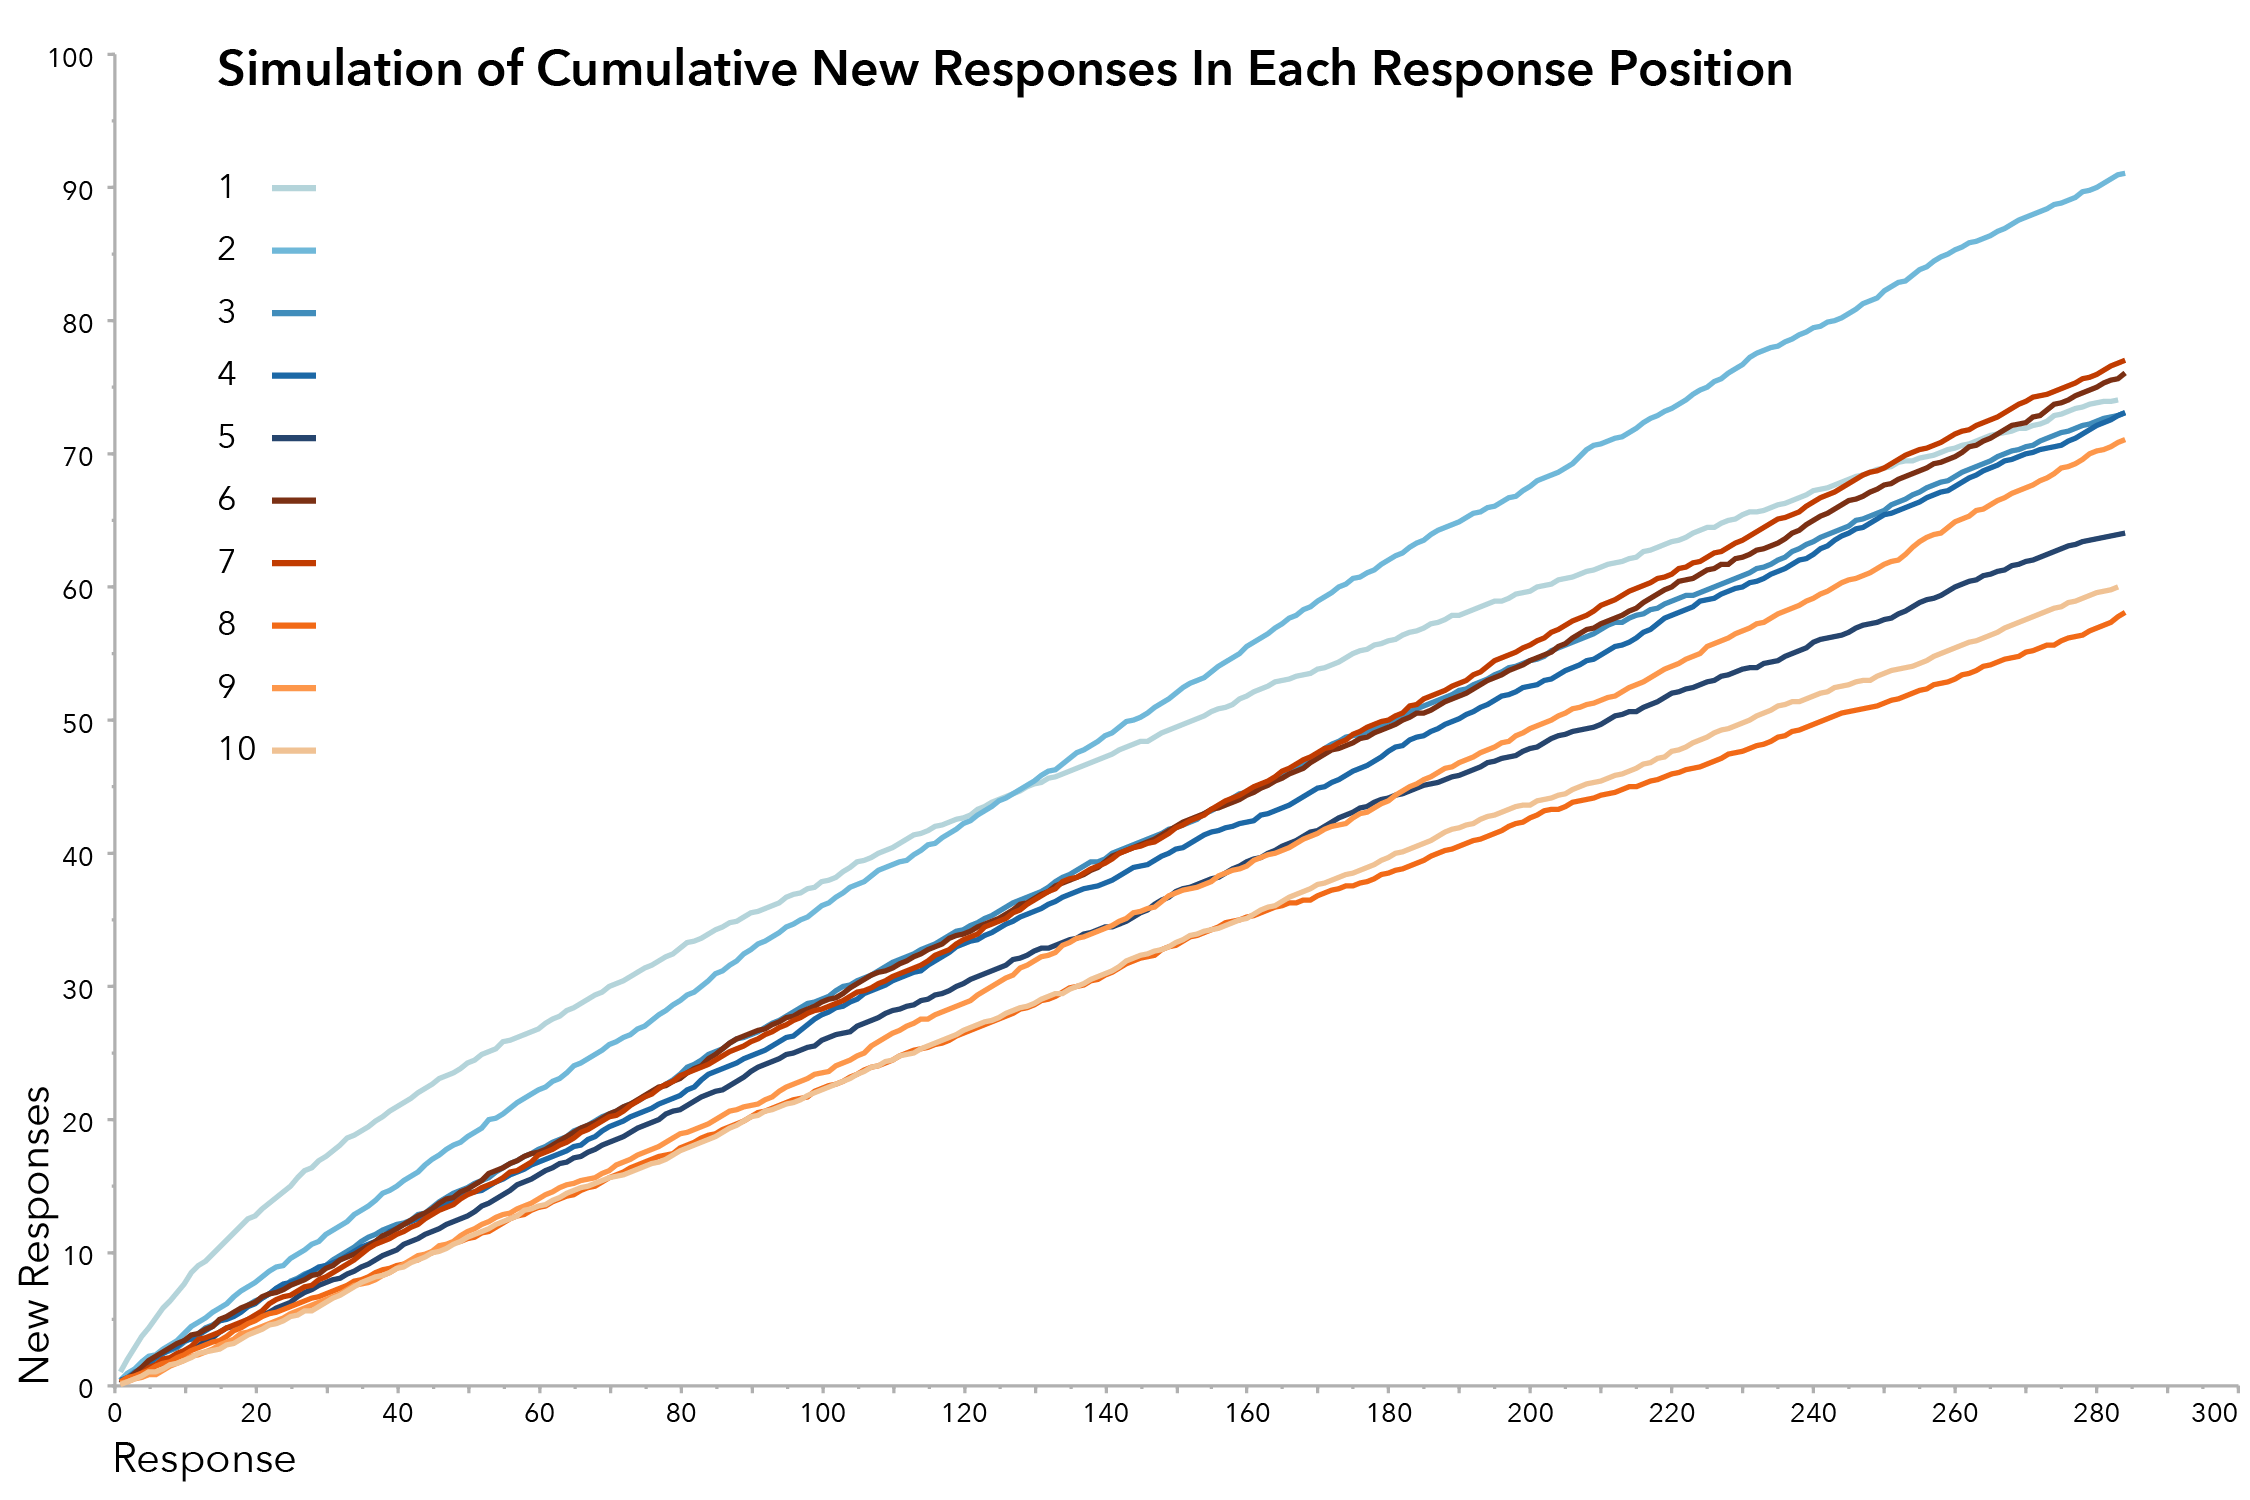
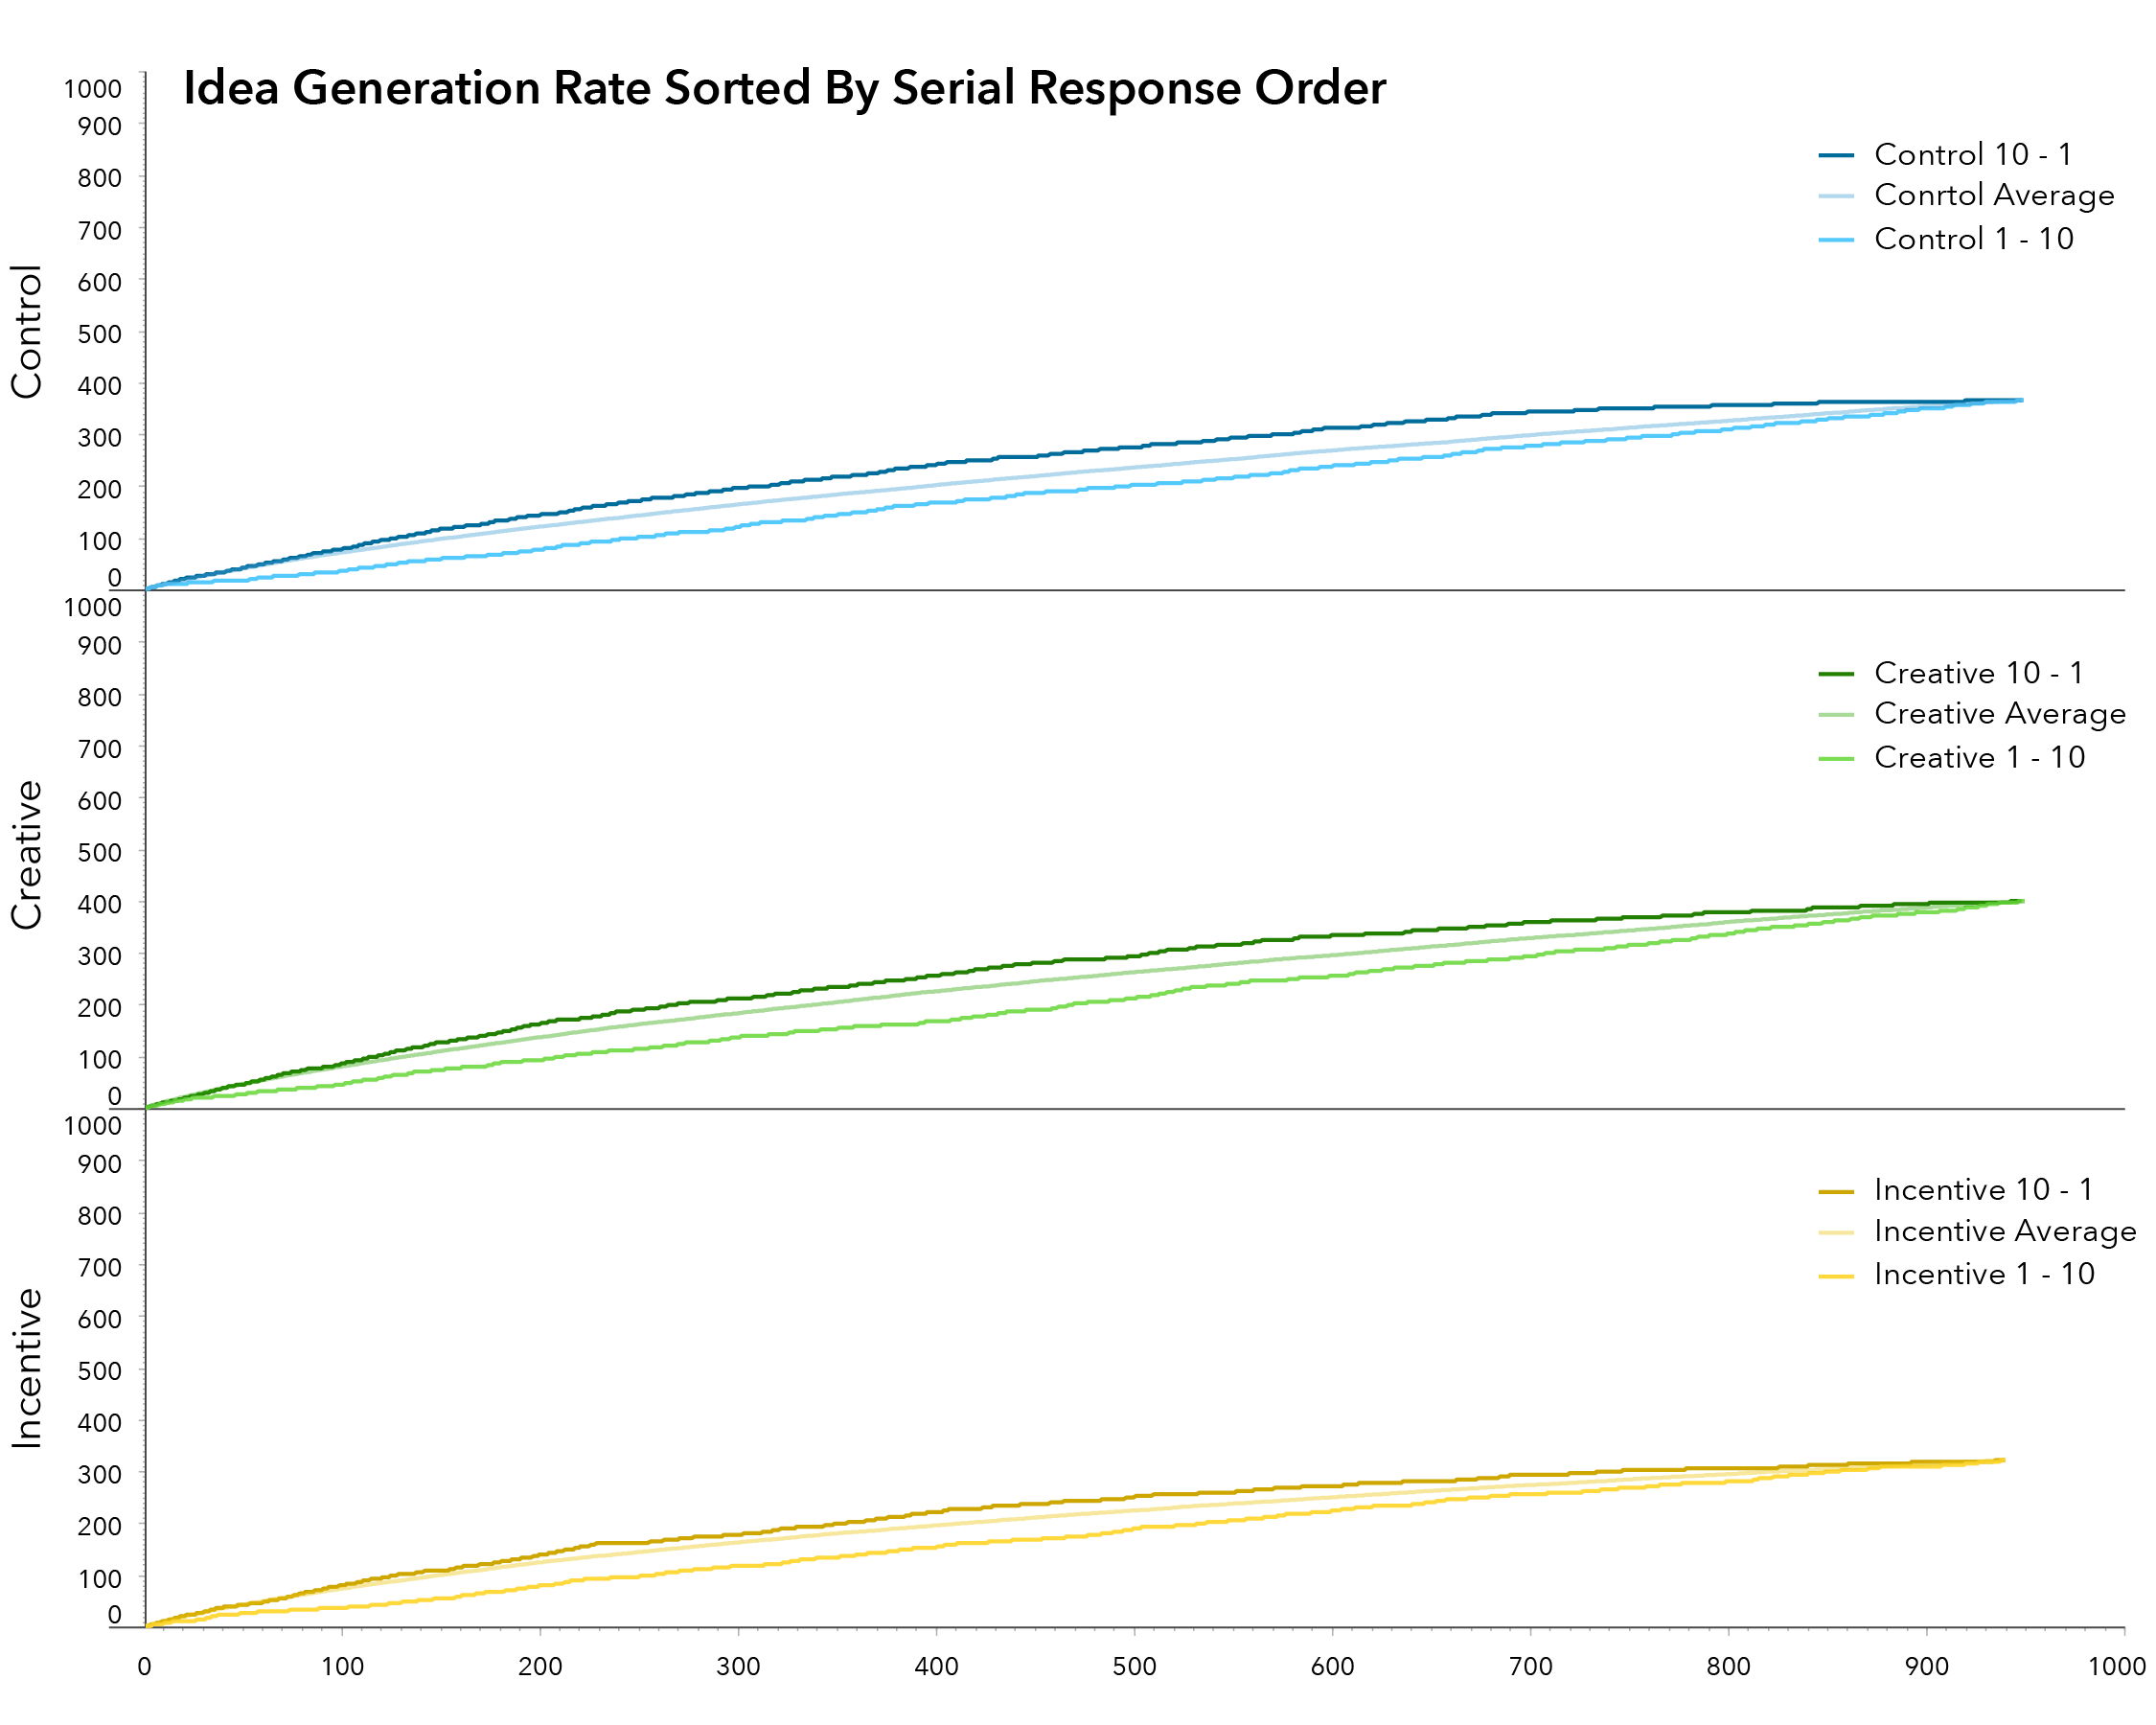
To chart the fluency of responses from AMT workers, a cumulative summation of all new responses had to be calculated. An exact curve illustrating this summation is difficult to chart because the order in which responses are counted is arbitrary. That is to say, the discrete intervals between new ideas can vary depending on how the data is sorted. For instance, sorting respondents by age in ascending order will illustrate a different curve than sorting respondents by age in descending order. This is due to the variability in the distribution of responses per response tag. In order to preform statistical analysis therefore, it was necessary to simulate many possible response sequencings and then test the sets of numbers against one another for to assess significance. To run the simulations, a constantly updating random number was assigned to each of the responses. The responses were then sorted using this random number (and other parameters), and the cumulative fluency of the simulation was calculated. Thirty simulated sample sets were generated and an average summation was calculated.
The serial order effect expects that fluency will decrease over time and idea quality will increase over time. It is important to note, at this point, that this study differs from previous demonstrations of the serial order effect. Past research that demonstrates this effect using divergent thinking tests that allow respondents to provide as many answers as they can think of in a given amount of time (usually 10 to 15 minutes). The project at hand differs from past studies in that it asked for a discrete number of responses (ten) and allowed workers to complete the task at their own pace with an average HIT completion time was about six minutes and forty seconds. Instead of time stamping the responses, responses were ordered one through ten. The analysis of the serial order effect in this project will use response order as means of measuring the rate of ideas generated over time.
The second methodology for measuring the quantity of ideas generated over time involved examining the response generation rate of each of the serial order positions in isolation. To do this, the aggregate pool of responses was sorted to group responses by each of the serial order positions (e.g. all ones, all twos…all tens). Responses were then randomized within each position and the cumulative fluency for each of the response positions was recorded. Thirty simulations were run to calculate an average response rate.
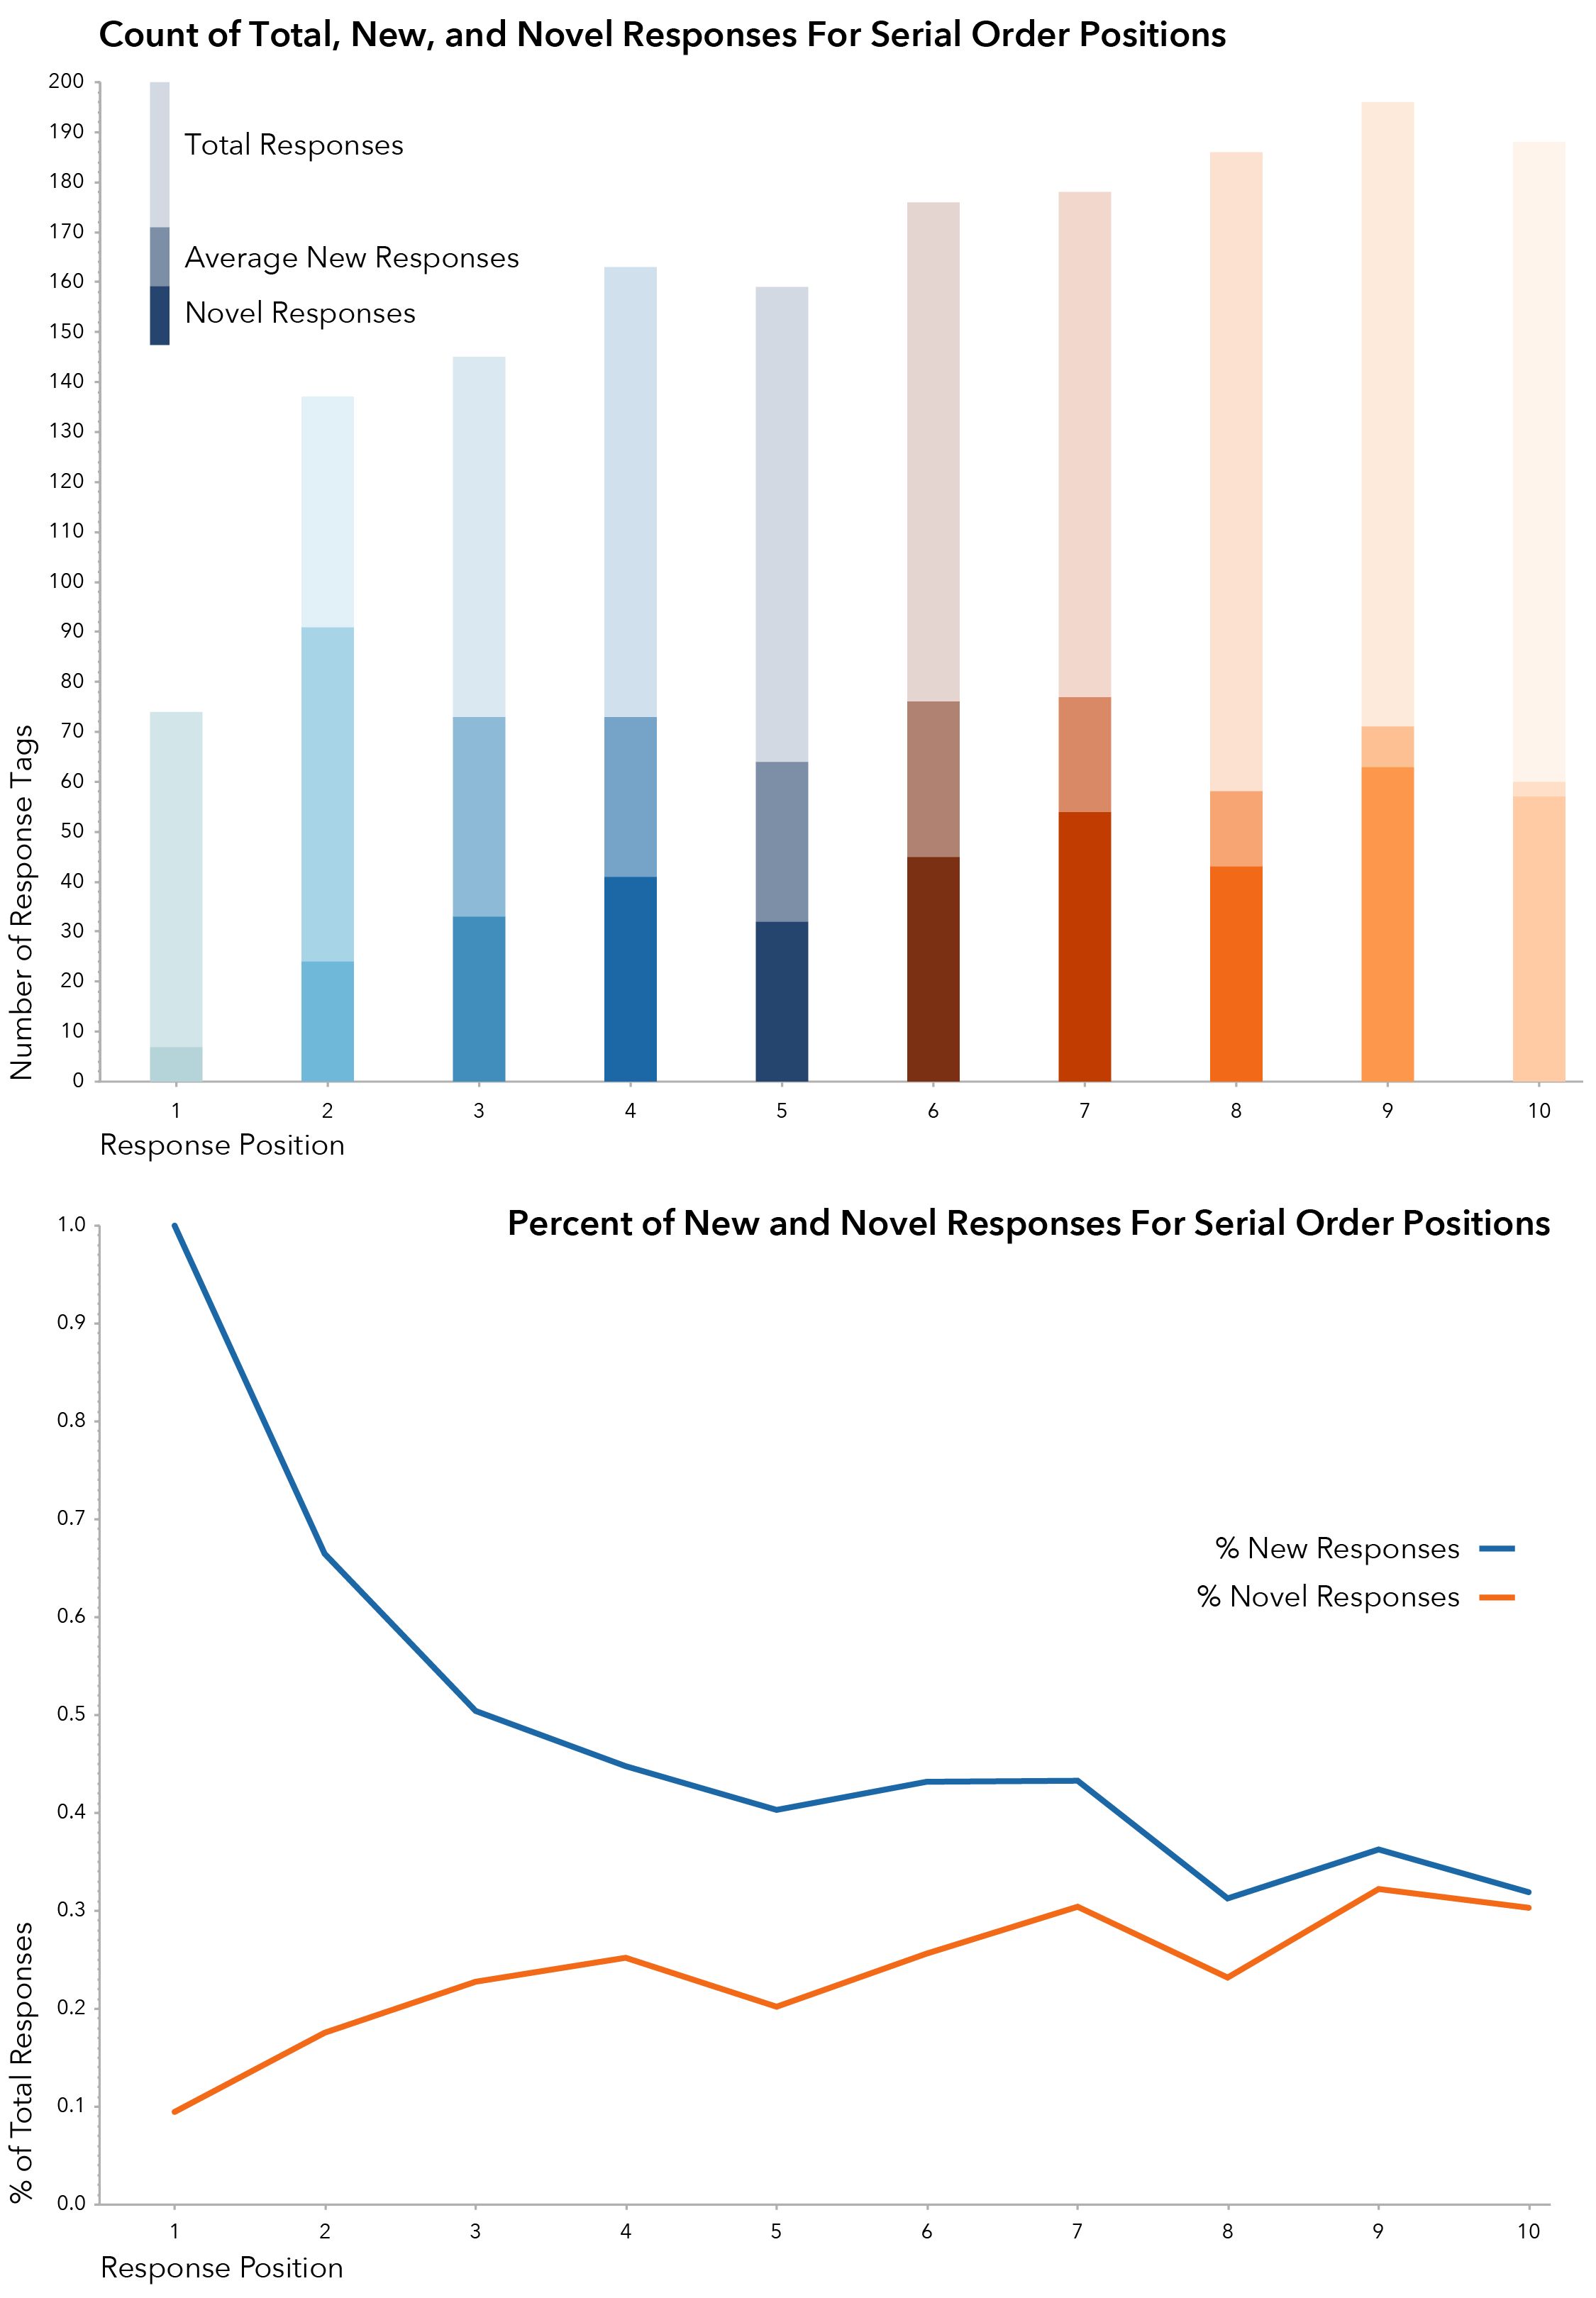
This technique demonstrates that when examined in sequential order, the quantity of ideas generated decreases toward the end of the response period. Exhibit 8 shows these response rates and indicates that more new ideas were generated in the early response positions (1-3) than the later response positions (8-10). This is consistent with previous findings of the serial order effect, demonstrating that the fluency of responses decreases over time.
In addition to measuring the rate and quantity of ideas generated over time to demonstrate the serial order effect, it is also necessary to measure the quality of ideas generated. For the purposes of this study, the quality of a given response was measured by the relative frequency at which that response occurred within the total pool of responses. This equates idea quality with idea novelty and builds off of past research that bases idea evaluation solely on the measurement of idea novelty (Firestein, 1990; Dennis & Valacich, 1993; Crowne & Ross 1995). Completely unique responses were given a novelty score of 1. Less than completely unique responses were assigned a novelty score based on the following formula:
Novelty=1- (Total Occurances of Response)/(Total Responses)
For example, Build House was the most common response given with a total of 119 occurrences out of 2,840 total responses for a novelty score of
Novelty of Build House=1- 119/2,840=0.958
On the other hand, 399 of the 2480 responses were completely unique, occurring just once in the overall set of ideas generated, and received a score of 1.0. This measure of relative frequency stands as the sole metric by which ideas are evaluated in this work.
Scoring the novelty of responses in this way allows an average novelty score to be calculated for each of the response positions. Additionally, it identifies each of the completely unique ideas . This analysis indicates that responses in the later response positions were generally more novel than responses in the earlier positions. The total number of completely unique ideas in the first half of responses, for example, was 137, as opposed to 262 completely unique responses in the later half. When looked at as a percentage of the number of responses given for each of the response positions, generation of new ideas decreased over time, and the percentage of completely novel ideas, increased over time. These trends are illustrated in Exhibit 9. While the response collection methodologies used in this work differ from those of past work, this project shows several unconventional testing methodologies that suggest that the serial order effect is present in this crowd based population.
Simulation of Response Rate for Three Question Frames
Explicit Instructions
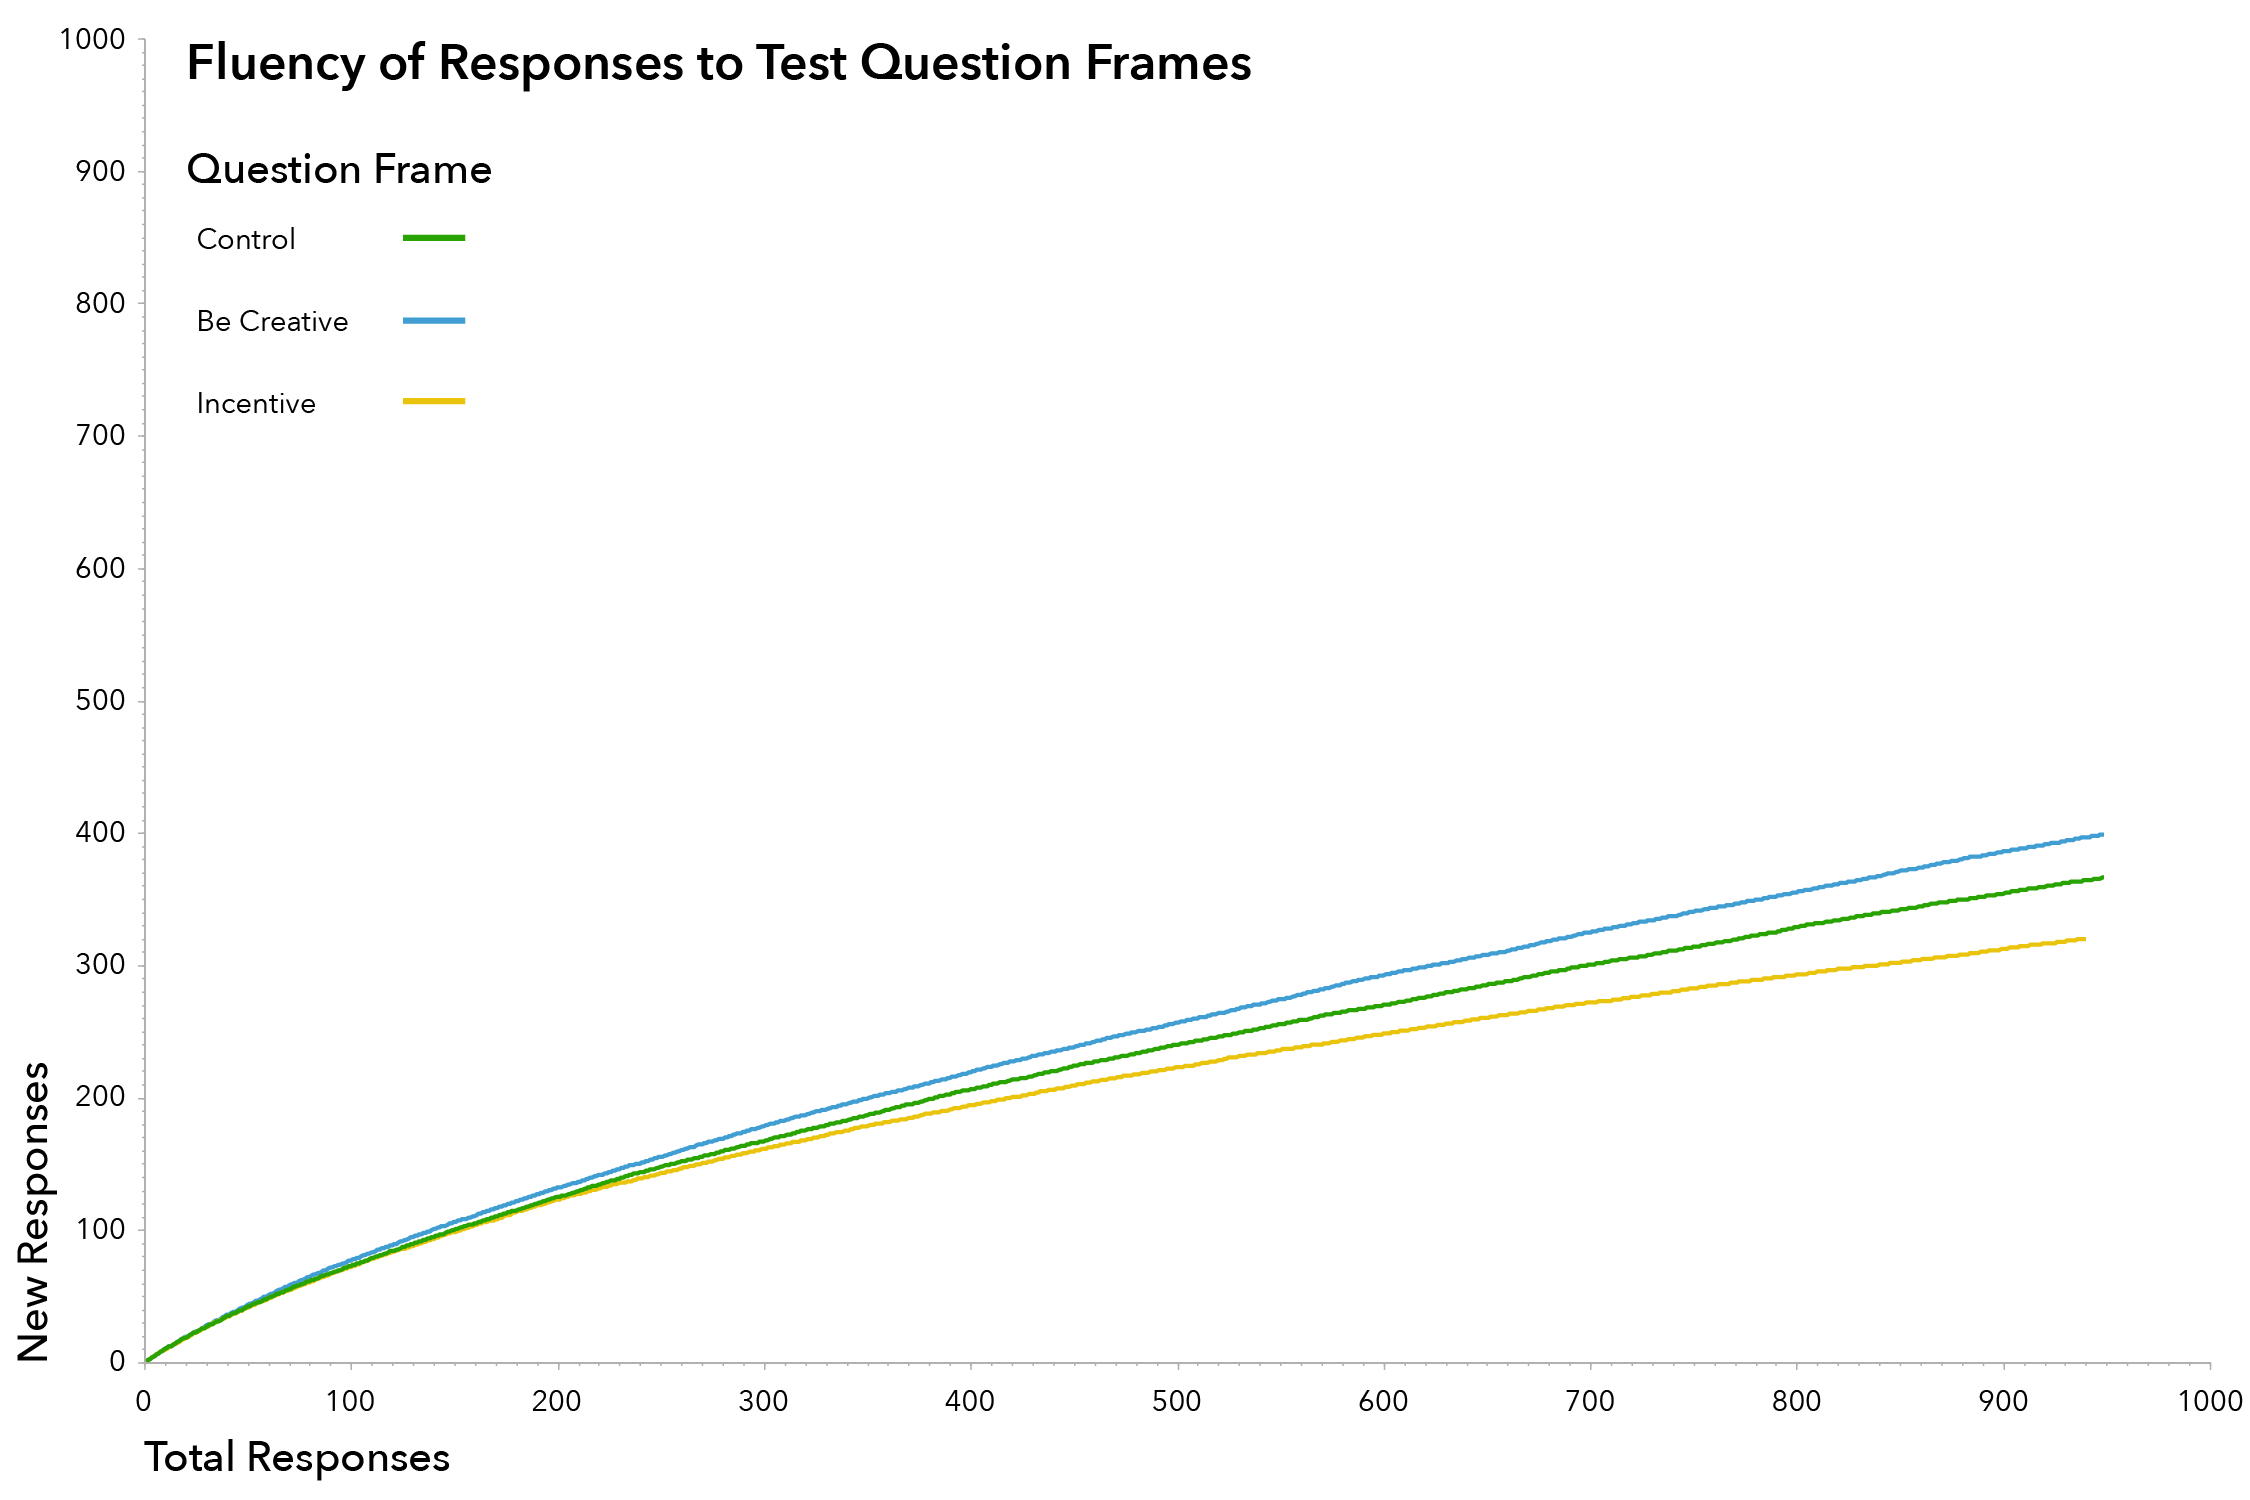
In this portion of the analysis, data from the thirty simulations of the question frame with explicit instructions to be creative was compared to data from the control question frame. The hypothesis stated that instructing respondents to think creatively would increase the overall rate of idea generation. The comparison of these two factors is highly significant with a P-value of 0.0087 at the lowest response level and confirms the hypothesis that explicit instructions to think creatively will increase the rate and quantity of ideas generated. Comparisons at higher response levels are more likely to show significance as the number of samples approaches the total number of responses.
Monetary Incentive
The introduction of an additional monetary reward was hypothesized to increase the response rate. The charts illustrate that, when compared to the control group, respondents generated fewer new ideas when a monetary incentive was provided (above and beyond the reward paid to the worker for completing the task). Statistical analysis shows that comparisons at the lower levels of responses (50, 100) between this group of respondents and the control group is not significant. At the 250-response level, however, the comparison between the datasets is highly significant. There are several factors that may account for this finding, first among which is the fact that respondents were paid a base amount for completing the task, regardless of their level of effort or creativity. The abstract promise of a potentially higher reward may not have been enough to further incentivize a worker who is already being paid. Another possible factor that may effect this analysis is the high proportion of respondents from India (90%) for this question frame, compared with 63.4% and 36.6% for the control and explicit instructions question frames respectively. While the data does not represent a statistically significant relationship between the control group and the incentive group, it does suggest that providing an additional monetary incentive has the potential to reduce creative idea generation. More work is necessary in order to draw any conclusions regarding the effects of monetary incentives on the idea generation rate of crowd-based populations.
Demographic Tests of Data
Two levels of analysis were conducted to understand the relationship between two demographic factors (nationality and gender) on the rate of idea generation. The first analysis for each demographic factor uses the aggregated set of responses across all three question frames to test the significance of the relationship. Thirty simulations of this aggregated list were run to generate an average idea generation rate for respondents in each of the demographic groups. The second level of analysis examines the relationship between each of the demographic factors the idea generation rate for each of the three question frames. Thirty summations were run for each of these factors and significance was calculated using a t-test.
Nationality
The first level of analysis (i.e. aggregating all responses across the three question frames), yielded a total 1,740 responses from Indians and 1,010 responses from Americans. Exhibit 11 graphs the fluency rates of these two groups two groups and shows that the group of American respondents was able to generate nearly as many responses as the group of Indian respondents in about 60% as many responses. This further illustrates how the skew in population demographics may be attributable for the less than significant findings in the monetary effects section of the analysis. Sets of numbers from each group of responses were compared against one another, and statistical comparison of these two datasets indicates no significant relationship between the two groups.
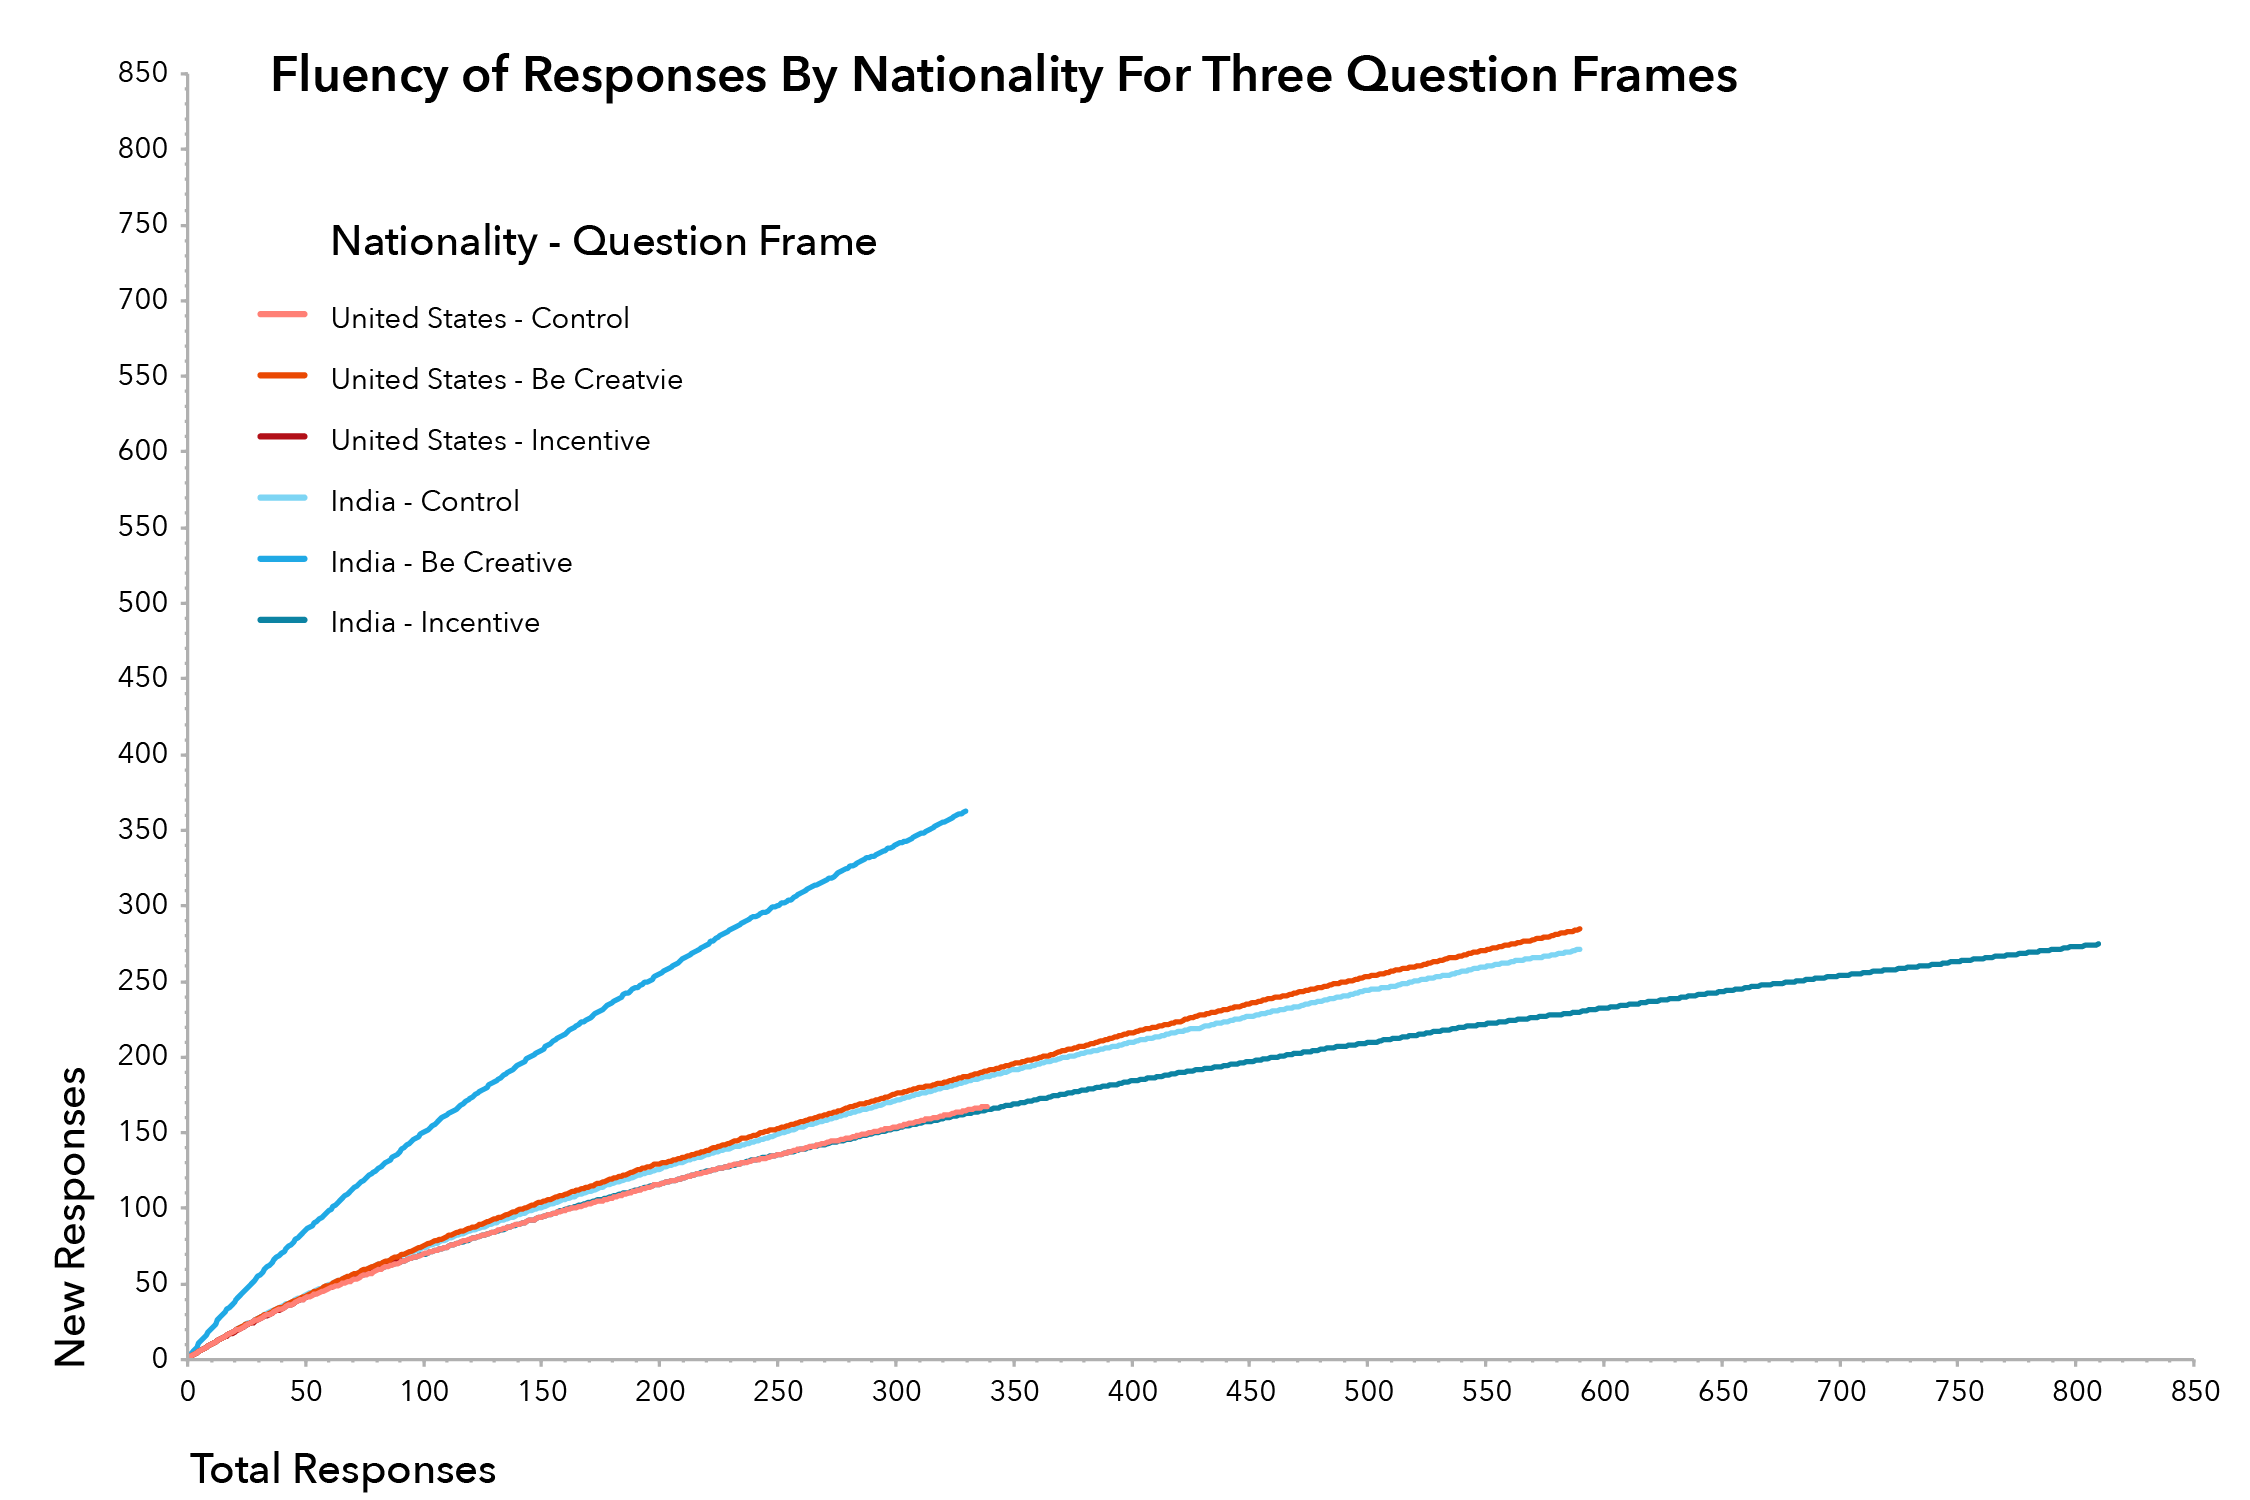
The second statistical study analyzes the performance of the two groups (Indians and Americans) across the three question frames (Exhibit 12). In this analysis, the set of numbers generated in the thirty simulations of responses from American for the be creative question frame and the incentive question frame were compared to the set of numbers generated from the simulations of American responses to the control group. The analysis indicates a significant relationship between explicit instructions to be creative and an increased idea generation rate for American respondents (Table 5). Furthermore, the analysis shows a significant relationship between an incentive to be creative and a decrease in the rate of ideas generated by the group of respondents from India.
Gender
Analysis of the aggregated set of responses for females and males across the three question frames yielded a total of 1290 responses for the female population and 1550 responses for the male population. Thirty simulations were run to calculate an average response rate for each group (Exhibit 13). This chart indicates that females had a slightly higher response rate than males. Statistical analysis shows no significant relationship between these two groups at lower fluency levels (50 and 100). Highly significant results are found when the groups are compared at the 200-response level (Table 7).
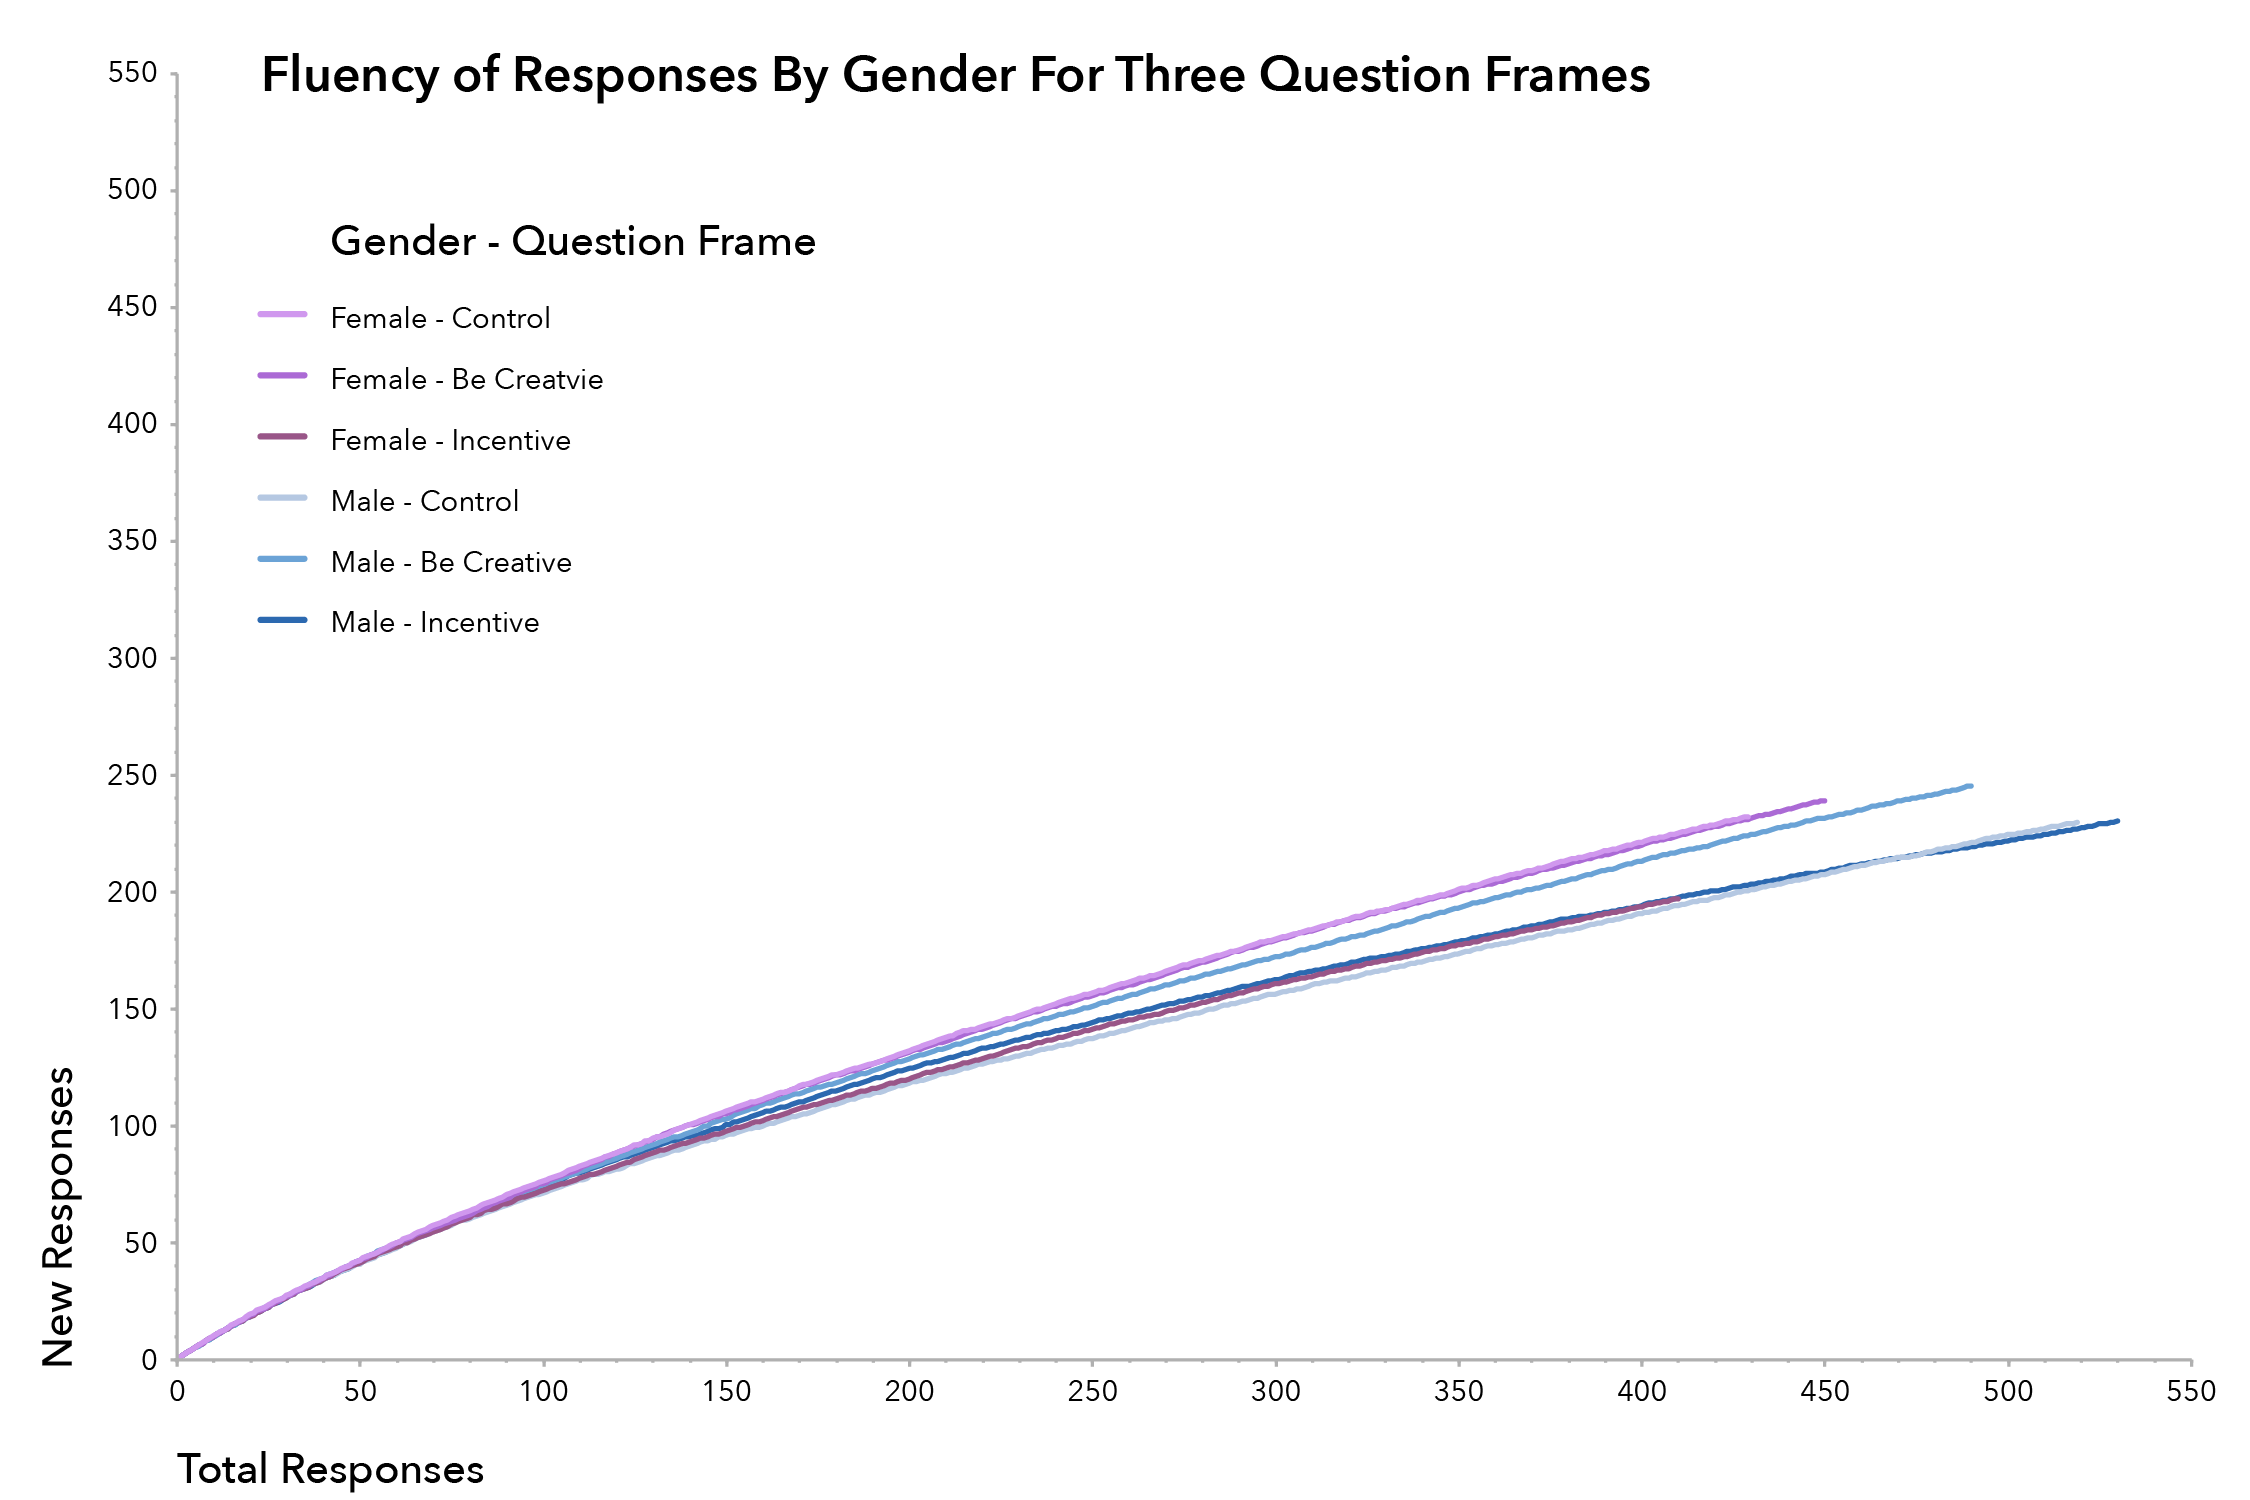
The second level of analysis shows high levels of significance for females when comparing the set of responses to the control question versus those for the incentive question frame (Table 8). A similar though less significant relationship is shown for the male population (Table 9). This indicates that the introduction on an incentive into the divergent thinking task decreased the response rate for both males and females. Highly significant results were also found when comparing the response rate of male to the be creative question frame. This indicates that explicit instruction had the effect of increasing the divergent thinking abilities of males in the test population.
Discussion
Measuring the quantity and quality of ideas is a long studied aspect in the field of creativity research. The advent of crowd-based populations provides researchers a new source of potential subjects to test long-held and emerging findings associated with creative idea generation and evaluation. This work confirms one of the oldest empirical findings in the study of creativity by demonstrating the presence of the serial order effect in this crowd-based population. The work also confirms that explicit instructions to think creatively can increase the quantity of responses generated. The work also shows that while there is no significant relationship between monetary incentives the quantity of ideas generated for the overall population, there is a significant that shows a decrease in ideas generated for Indian, female and male respondents when presented with an incentive. The findings of this research suggest that AMT has the potential to be an effective population for testing creative performance for divergent thinking tasks.
The work presented in this paper represents a new and valuable direction for research exploring creativity and creative idea generation. Past research explored how in-person groups, nominal-groups, and individuals generate new ideas. This work applies the constructs developed by past researchers to a new population and explores how massive crowds generate new ideas. This is important because technology is changing the ways in which workers communicate, generate, and synthesize ideas, so creativity is more than just in-person teams collaborating in a workplace setting. Additionally, the data collected from crowd workers could allow researchers the opportunity to explore how group composition might affect the rate and quality of ideas generated. Because the data can be sorted and simulated, various hypothetical group compositions could be tested against one another in order to identify an ideal group composition to maximize performance on a divergent thinking task.
Measuring the Effects of Explicit Instructions and Incentives
On the Idea Generation Rate of a Crowd-Based Population
by Allan Donnelly
Submitted to the Engineering Systems Division in Partial Fulfilment of the requirements for the degree of
Master of Science in Engineering and Managment
at the
Massachusetts Institute of Technology
©2013 Allan R. Donnelly. All rights reserved