Enterprise Architecture
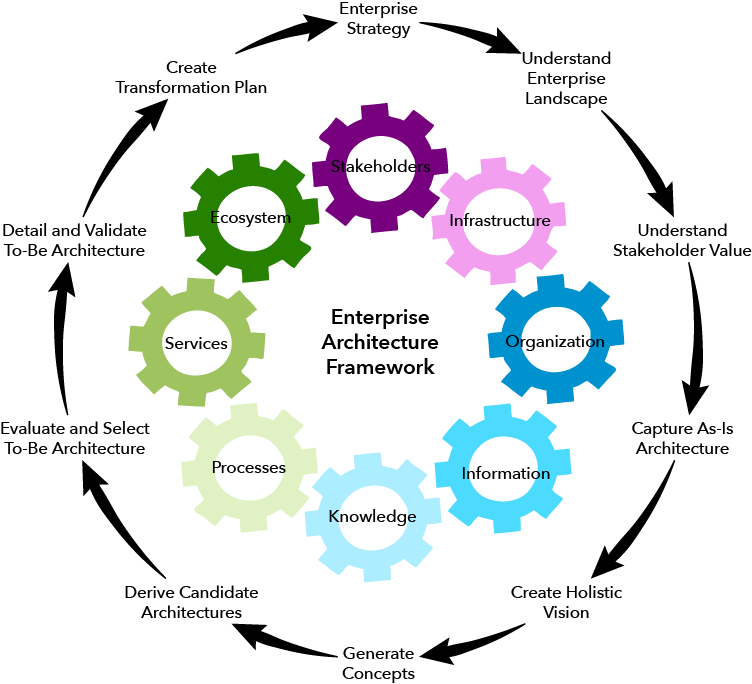 Enterprise Architecture (EA) is a systems approach to business and organizational design. The framework for enterprise architecting provides a holistic approach to analysing as-is enterprises and designing to-be enterprise systems. EA is more than just organizational design in that it accounts for all of the aspects of an enterprise system. Ten specific elements are used to describe and design an enterprise system: Ecosystem, Stakeholders, Strategy, Organization, Information, Knowledge, Processes, Services, Products, and Infrastructure. This project uses the EA framework as a methodology for developing an as-is model of an existing enterprise and the development of an innovative enterprise architecture to meet a strategic enterprise objective.
The EA framework utilized for this project was developed by Professors Deborah Nightingale and Donna Rhodes from the MIT Engineering Systems Division. This was a capstone project for my masters degree and I led and collaborated with four other teammates in the development of this enterprise strategy. Our team worked with a sponsor organization to develop a strategic goal for the project. The sponsor organization was an architecture and design firm with expertise in the health care and higher education sectors. I acted as liaison with the sponsor organization. I also organized and led project team meetings to facilitate team knowledge sharing and concept development. The graphics created for this project were meant to illustrate the various aspects of the enterprise system and to maximize the impact of communication for fairly complex ideas.
The sponsor organization is an architecture and design firm with headquarters in Boston and offices in Phoenix and San Francisco. The firm primarily provides architecture design and coordination services, but also offers space and master planning services, and construction administration services. The company operates primarily in the health care and higher education sectors and has expertise in other building typologies such as libraries, courthouses, and laboratories.
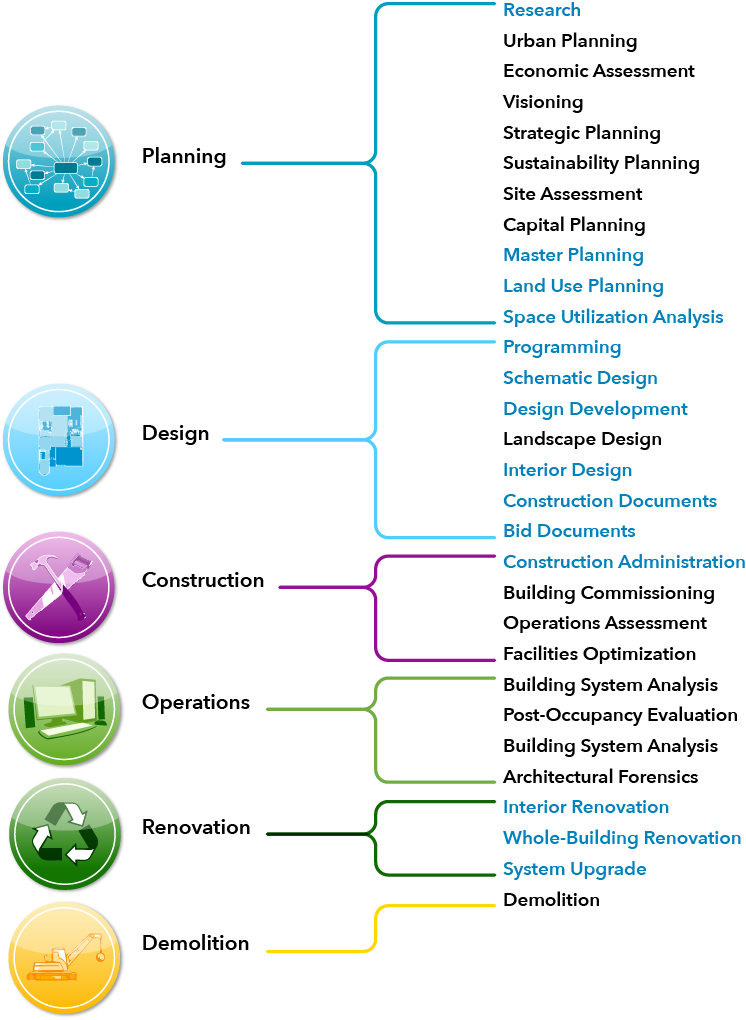
The strategic goal for this project was to develop a strategy and implementation plan for the firm to expand its service portfolio into work upstream and downstream of its current offerings. This objective was arrive at through conversations with the CEO and the board of directors. Defining upstream and downstream services was an important part of the problem definition phase, so we broke the building production process into six building lifecycle phases. We then charted where the enterprise offered services in the building lifecycle. I then researched the kinds of services that other architecture firms were offering and those offered by firms operating in the upstream and downstream spaces. This provided a sense of the kinds of services that might be offered upstream and downstream of the company’s current service portfolio.
In order to fully understand the context in which the enterprise enterprise exists, it was necessary to conduct an in depth analysis of the architectural design services landscape. This analysis explored the architectural services industry in the United States in terms of revenue. Additional information was provided about the size of the industry in terms of number of architects employed word wide. Data for this analysis was collected from industry publications (Architectural Record, 2012; Arch Daily, 2013). The analysis covers a six year period beginning in 2007 and ending in 2012. The accompanying diagrams illustrate the findings of this ecosystem analysis.
The findings of the research illustrate the consolidation in the industry that followed the economic collapse in 2008-2009. Time series data shows that the organisation’s revenues declined with the entire industry in 2009 but then remained stable in terms of overall revenue in 2010 and 2011 while the rest of the industry declined overall. The data shows some recovery for the industry in 2011, but no change between 2011 and 2012. Furthermore, the revenue data show a greater skew toward the nigher earners in 2011 and 2012, illustrating a greater squeeze on mid-sized firms. The data for the sponsor organization illustrates that after remaining stable through the downturn, company revenues increased in 2012. These findings suggest that the firm was somewhat buffered from the economic decline due to the sectors in which it operates. Health care and higher education remained bright spots in the larger economy and provided a foundation for the firm to build upon. Further growth in 2012 indicates that the company is growing healthily while the growth was flat industry-wide. The flattening of the revenue curves and the pressure placed on mid-sized firms illustrates the need for new revenue streams and the diversification of the service portfolio.
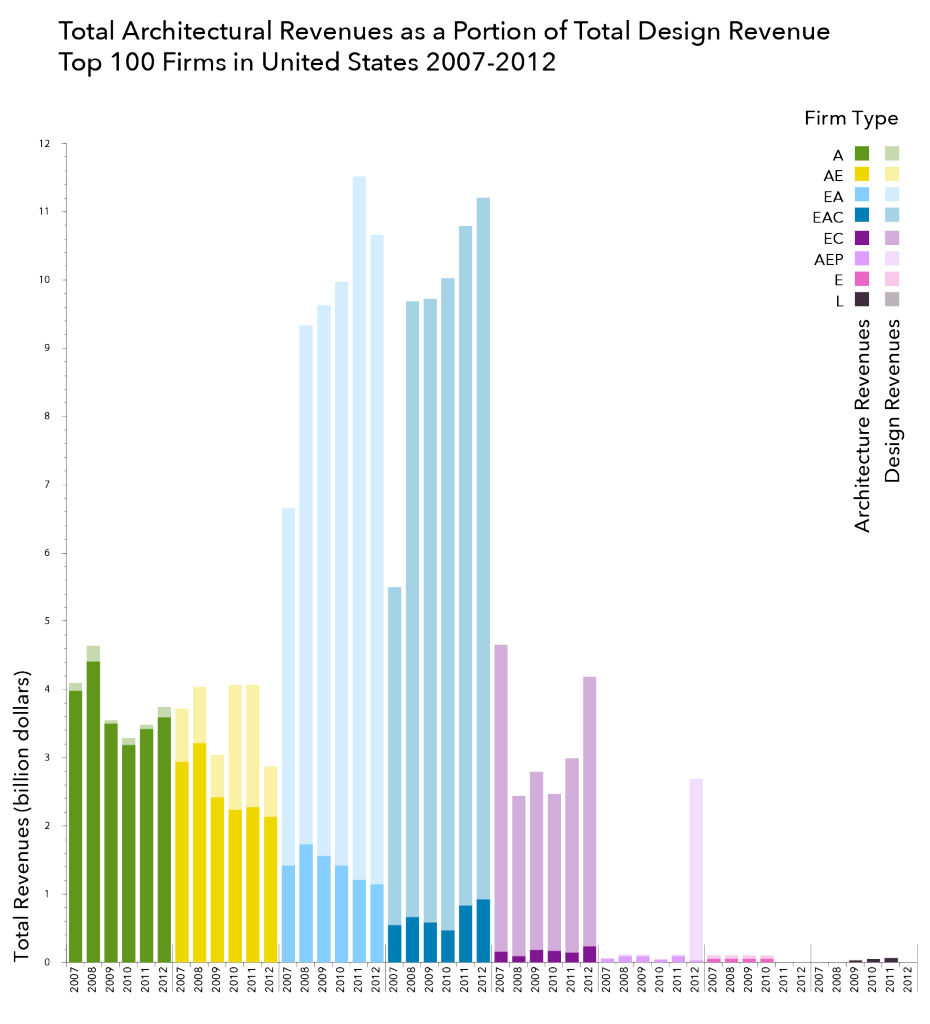
The final aspect of the ecosystem analysis that was critical for this project was the comparison of architectural revenues to total design revenues for the various firm types in the industry. This analysis shows that while firms operating solely in the delivery of architectural services are dominating market share in terms of architectural revenues, there is a great deal of value begin captured by competing firms in design services associated with architectural projects. This insight was critical because it led the sponsor organization team to formalize its desire not to offer engineering design and construction services, but rather to focus on strategic design and planning services.
Another critical aspect of the enterprise architecture framework emphasizes a clear definition and understanding of the value delivered by the enterprise and needs and values of the stakeholders within the enterprise. Three types of stakeholders are defined for this enterprise. Primary Beneficiaries (Client Officers, End Users) are the stakeholders for whom the system is designed to deliver value. Beneficial Stakeholders are those who benefit from the success of the enterprise but have no vested interest in the ultimate outcomes of the work (Enterprise Officers, Principals, Employees, and Consultants). High leverage stakeholders are those who have the power to make demands that define and constrict enterprise growth and operation (Investors).
A list of enterprise level values associated with each of the stakeholders was developed by the project team. The list was then validated and prioritized by the sponsor team. The accompanying diagrams illustrate how values of Money, Knowledge, Services, Resources, Information, and Relationships flow between each of the stakeholders in the enterprise.
Charting the value flow in this way provided many insights about the relationships between the stakeholders. First, it was identified that money and services have a reciprocal flow relationship. This finding illustrates the primary value exchange of the enterprise. The second finding shows that knowledge flow loops happen internally to each organization. This implies that the future architecture needs to be designed so as to facilitate internal knowledge flows. The last and most important finding is the system-wide importance of information flows. The diagram clearly suggests that information flow is critical to successful service delivery. It also illustrates the central role that Shepley Principals hold in the capture and dissemination of relevant information. These findings set the parameters for which the to-be architectures will be judged by the system stakeholders.
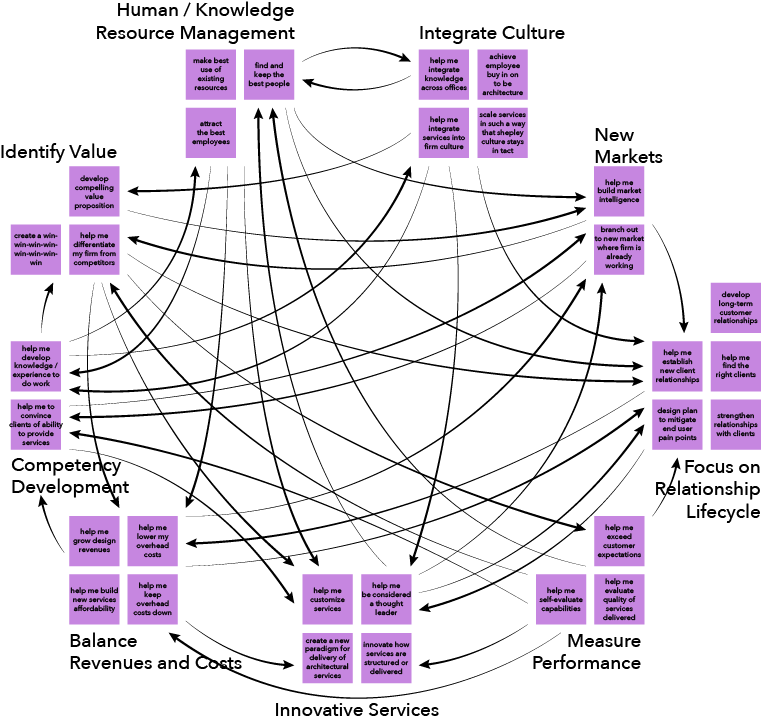
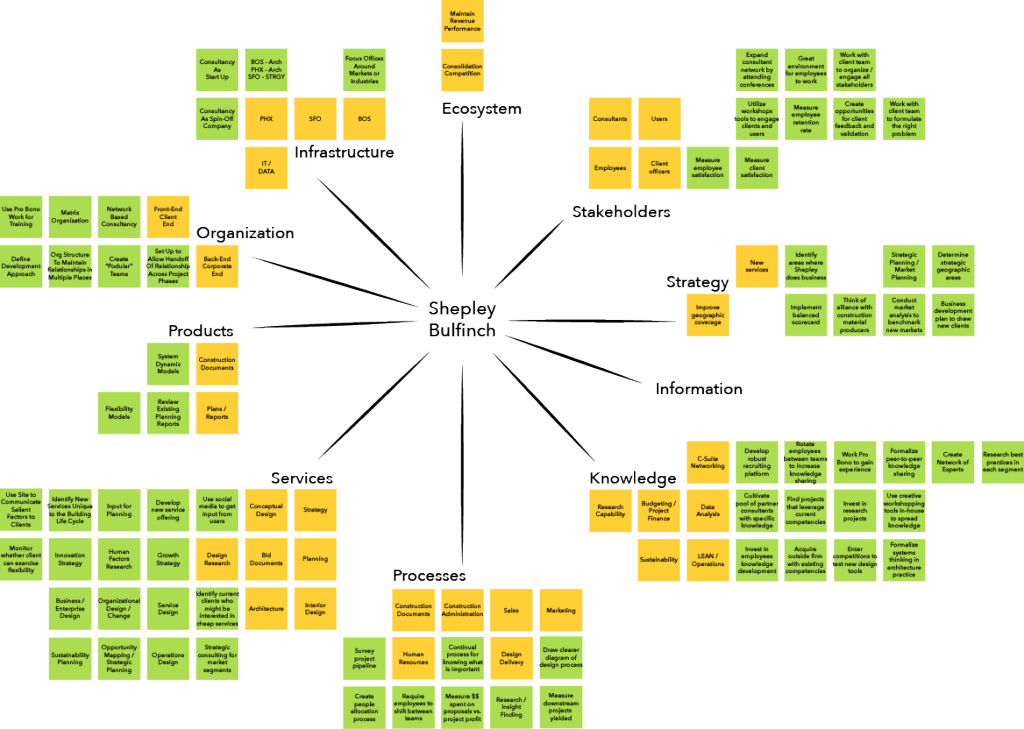
In order to facilitate the concept development process, I designed and led a series of brainstorming exercises to engage my team in knowledge sharing and sense-making processes. I used a series of tools to facilitate the divergent, exploratory, and convergent thinking aspects of team brainstorming. We began by creating an objective list of evaluation criteria before any ideas were shared. I then asked my teammates to imagine themselves as the Enterprise Officers and to generate “Help Me…” statements that represented stakeholder pain points. These “Help Me…” statements were then grouped into categories and the relationships between the categories were charted to identify root cause issues. This map identified Human/Knowledge Resource Management and Performance Measurement as root causes driving the system pain points. Furthermore, it was identified that designing the system to deal with these pain points would enable the enterprise to achieve its goals in providing innovative services and focusing on long-term client relationships. In a second exploratory exercise, I asked the team to identify elements of the as-is and to-be architectures in terms of the ten EA views. Team responses were sorted in multiple ways, and four architectural concepts were identified. The third exercise engaged the team in high level mapping of the ten EA view elements to the four concepts.
The four candidate architectures were refined and presented to the sponsor organization for validation and feedback. Through this process, it was decided that the most appropriate candidate architecture for the to-be enterprise was an Operations and Organizational Design Consultancy. The sponsor team also requested that the to-be architecture contain a research and development capability. With this decision, the project team began to develop details of the architectural model. Details include the structural and behavioral aspects and the artifacts and metrics associated with each of the enterprise architecture views. The enterprise views most important to this project were Services, Knowledge Processes, and Organization.
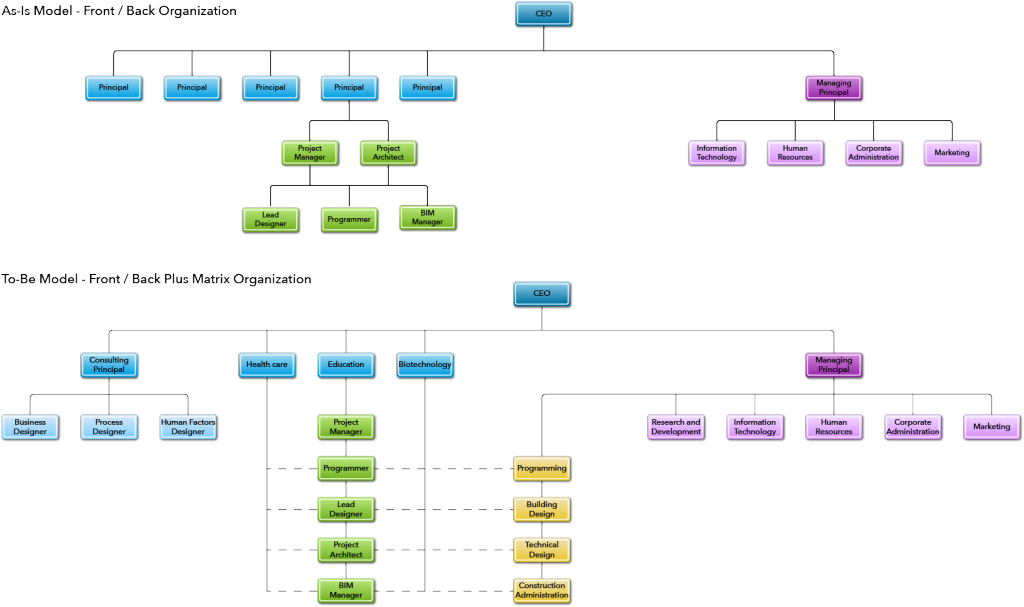
This new architectural model will require the firm to develop a set of competencies that are tangential to yet still outside of its current range of capabilities. The services-based nature of the enterprise means that successful outcomes are highly dependent on the knowledge, skill, and talent of the people performing the service. In order to deal with these needs, the enterprise should reorganize from a Front/Back organizational design to a matrix-plus design. This organizational redesign formalizes the functional aspects of the architectural project work by creating functional directors. Project teams would report directly to the project principal and would have dotted line reporting to a functional director. This would allow the firm more flexibility in the staffing of its project teams and ensure greater project quality and accountability. It would also allow the company to benefit from economies of scale by consolidating its functional competencies and investing in training of functional competencies. Planning services would be led by a Design Consulting Principal who would report directly to the CEO. The back-end corporate functions of the enterprise would continue to be run by the Managing Principal. This design incorporates the Research and Development function into the back-end of the enterprise.
 The X-Matrix is a tool that helps to align the various aspects and details of the to-be architecture. The matrix is actually a set of four matrices that chart the relationships between Stakeholder Values, Strategic Goals, Metrics, and Key Processes. A strong relationships is indicated by a dark box and a weaker relationship is indicated by a medium toned box. The lightest boxes in each quadrant represent no relationship between the elements.
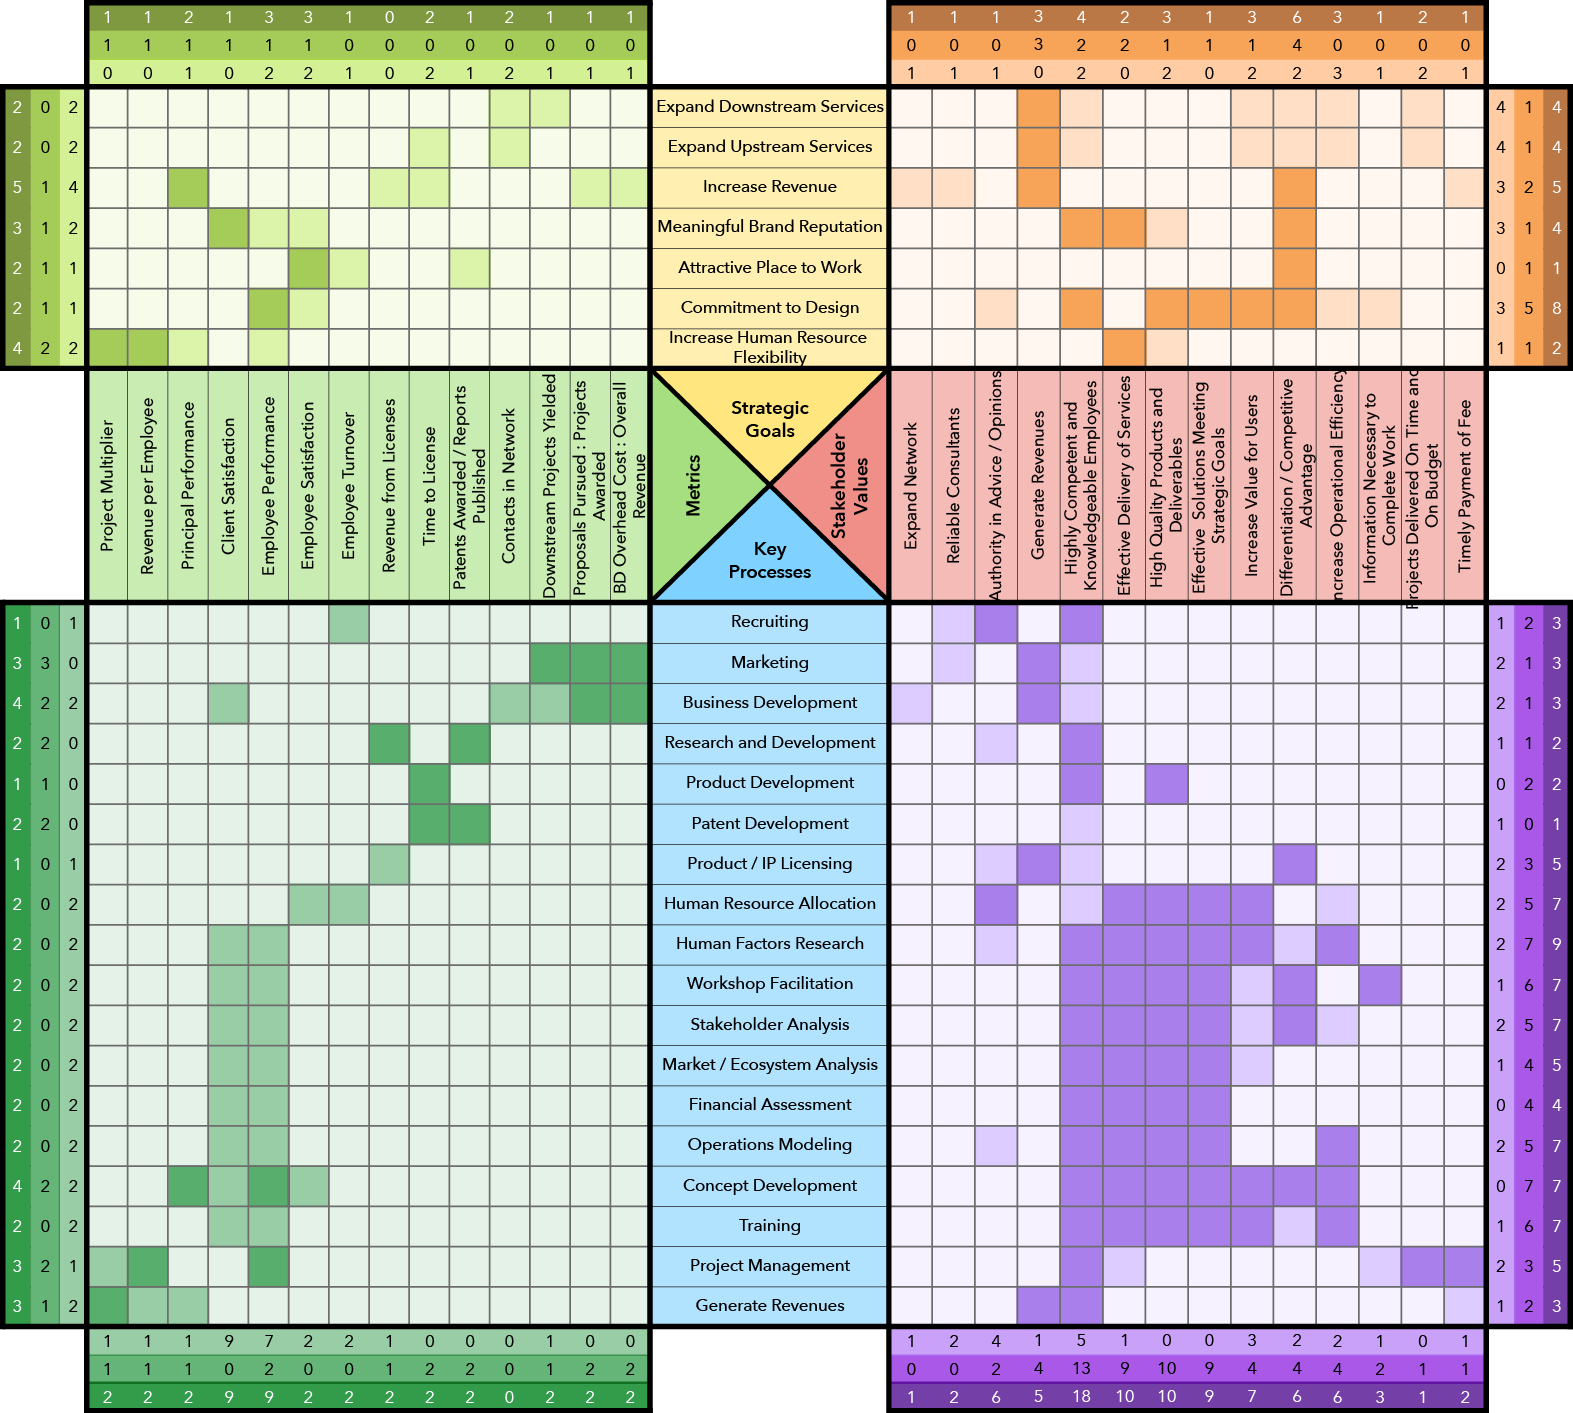
Analysis of the Stakeholder Values and Strategic Goals quadrant shows that a strong commitment to design is an imperative strategic goal for sponsor organization in the new service delivery. The primary stakeholder values met through this design are differentiation and competitive advantage and highly knowledgeable and competent employees. Increasing revenue is another important metric at play in this quadrant as it is in the following quadrant comparing Strategic Goals and Enterprise-Level Metrics. This quadrant shows that there is at least one metric associated with each strategic goal, and that all but two objectives have at least one strongly associated metric. Increasing Human Resources has the most metrics in hopes to assure that resource management is flexible and effective.
The third quadrant charts the relationships between Enterprise-Level Metrics and Key Processes. There are four main couplings shown in this part of the matrix. The first coupling shows a strong level of measurement of corporate functions like recruiting and business development. The second grouping shows the metrics associated with measuring the performance of the Research and Development aspect of the to-be architecture. The third coupling shows the importance of evaluating client satisfaction and employee performance when measuring the success of the processes associated with the consulting aspect of the enterprise. The final couple shows the existing metrics used to measure enterprise performance on project management and revenue generation. This quadrant illustrates that the to-be architecture is designed to measure and ensure a high level of performance for the services that it provides.
The final quadrant maps the relationships between the Key Processes and the Stakeholder Values. The primary thing to note here is that highly knowledgeable and competent employees effect each of the key processes. Surrounding this bus structure are two metatasks. A loosely coupled metatask is defined around the enterprise’s corporate functions in terms of value delivery. A much more strongly coupled metatask is illustrated between the enterprise consulting processes and the delivery of stakeholder value. In all, this X-Matrix represents a holistic architectural solution for the development of new services at a mid-sized architecture and design firm.