Sloan Gear is a student run retail venture. The company is designed to give management students the opportunity to learn first-hand the successes and challenges of running a small retail company. The company designs and orders apparel and other items with custom graphics, namely with the MIT and MIT Sloan logos. This project examines the email communications between company team members so as to explore the project process and the organizational dynamics of the project team. In order to understand the dynamics of the project process through the data tied to email communications, I used network analysis, time line charts, and time-based design structure matrices.
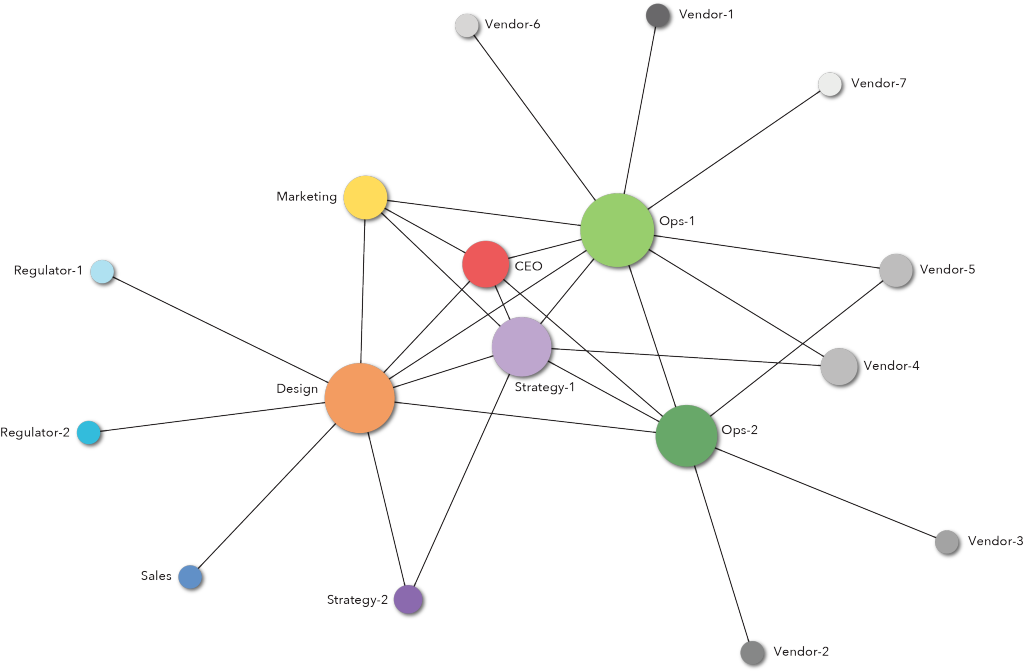
 In all, 208 and emails were collected from the time between 1 June 2012 and 21 September 2012. The following kinds of information were collected: Sender, Receiver, CCed, Time, Zone, Date, Email Subject. In order to better understand the relationships between the team members, I used network analysis to chart the patterns of sending and receiving emails. The following diagram illustrates the project network and the relative importance of each of the players. Specifically, the size of the circle corresponds the betweenness factor of the team member. In network analysis, betweenness is a measure of how many connections pass through a node in the network. In other words, betweenness identifies the brokers in a system. This visualization tells us that the Design and Ops-1 team members are the central actors in this project, and that Ops-2 and Strategy-1 members are central players as well.
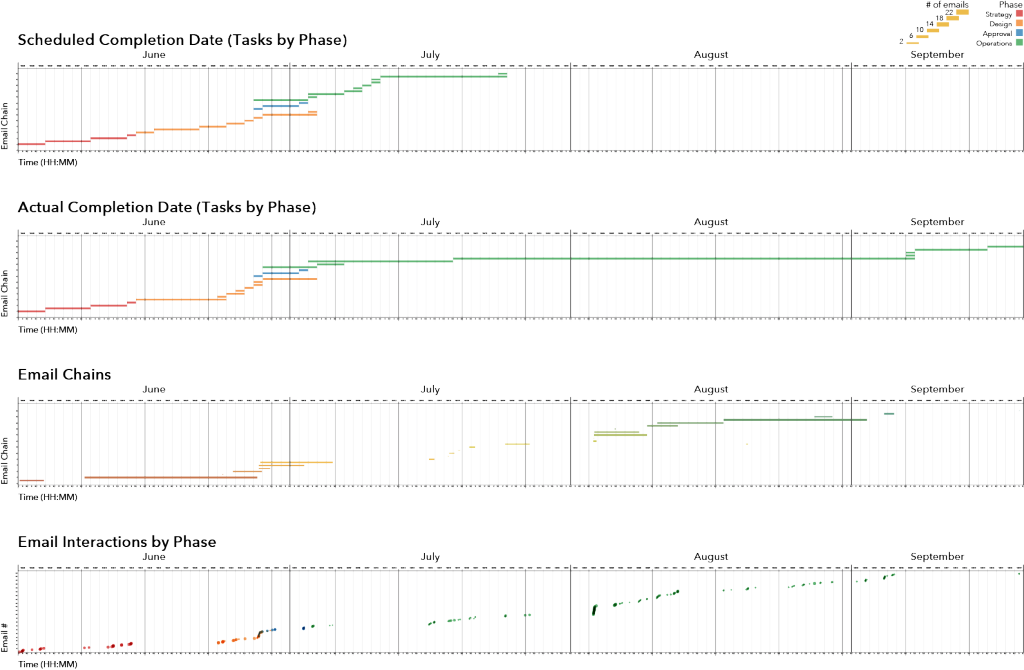
The charts above page depict the email communications over time. The charts illustrate the scheduled and actual task completion times, the durations of email chains, and the individual email communication events. The charts illustrate two interesting patterns in group communication: Long durations of radio silence, and instances of “rapid-rise” in communication. The durations of no communication are likely due to the fact that team members were dispersed on summer internships, and saw this company as a second priority. The instances of rapid-rise in communications correspond to deadline and critical path tasks. In both cases, communications were begun with a brief (chain duration) email, followed by a rapid succession of longer duration chains. I hypothesize that the kind of thinking underlying this type of communication pattern is one that realizes that certain work needs to be done, and that it needs to be now. The initial email is a communication of intent after a period of stagnation, and the subsequent email chains are focused on working through the tasks that have been delayed.
The diagram below is a matrix depicting the specific interactions between project team members. Senders are listed on the y-axis and receivers are listed on the x-axis. The size of the circle corresponds to the number of interactions from the sender to the receiver. The diagram further illustrates the centrality of the Design and Ops-1 roles to the project process. The linear nature of the interactions-to and -from both of these players indicates that they are the champions for different parts of this project. Another smaller relationship is illustrated in the center of the matrix between Strategy-1, Ops-1, and Ops-2. This represents the rework cycle in the project process. This is important because it means that there is a crucial hand-off of project knowledge between these two team members. The adjacent diagram illustrate the team communication patterns over time, as partitioned by email chain.